
To overcome the risk of being relegated to a utility or dumb pipe, TSPs today are looking to diversify, adopting alternative business models to generate new revenue streams.
In recent times, adopting customer experience (CX) and data monetization initiatives has been a key theme across all industries. Although many Tier-1 TSPs are leading this transformation by using new technologies to improve CX and improve profitability, many TSPs have yet to embark on this challenging but rewarding journey.
Building and implementing a CX management and data monetization strategy
Data monetization is often misunderstood as making dollars by selling data, but what it really means is to drive revenue by increasing the top line or the bottom line. It can be tangible or intangible, internal or external, or by making use of data assets.
According to Gartner, most data and analytics leaders are looking to increase investments in business intelligence (BI) and analytics (see the following study results).

The preceding visualization is from “The 2019 CIO Agenda: Securing a New Foundation for Digital Business”, published October 15, 2018.
Although the external monetization opportunities are limited due to strict regulations, a plethora of opportunities exist for TSPs to monetize data both internally (regulated but much less compared to external) and externally via a marketplace (highly regulated). If TSPs can shift their mindsets from selling data to focus on using data insights for monetization and improving CX, they can adopt a significant number of use cases to realize an immediate positive impact.
Tapping and utilizing insights around customer behavior acts like a Swiss Army Knife for businesses. You can use these insights to drive CX, hyper-personalization and localization, micro-segmentation, subscriber retention, loyalty and rewards programs, network planning and optimization, internal and external data monetization, and more. The following are some use cases that can be driven using CX and data monetization strategies:
- Segmentation/micro-segmentation (cross-sell, up-sell, targeted advertising, enhanced market locator); for example:
- Identify targets for consuming baby products or up-selling a kids-related TV channel
- Identify females in the age range of 18-35 to target for high-end beauty products or apparels
You can build hundreds of such segments.
- Personalized loyalty and reward programs (incentivize customers with what they like). For example, movie tickets or discounts for a movie lover, or food coupons and deals for a food lover.
- CX-driven network optimization (allocate more resources to streaming hotspots with high-value customers).
- Identifying potential partners for joint promotions. For example, bundling device offers with a music app subscription.
- Hyper-personalization. For example, personalized recommendations for on-portal apps and websites.
- Next best action and next best offer. For example, intelligent bundling and packaging of offerings.
Challenges with driving CX and data monetization
In this digital era, TSPs consider data analytics a strategic pillar in their quest to evolve into a true data-driven organization. Although many TSPs are harnessing the power of data to drive and improve CX, there are technological gaps and challenges to baseline and formulate internal and external data monetization strategies. Some of these challenges include:
- Non-overlapping technology investments for CX and data monetization due to misaligned business and IT initiatives
- Huge CAPEX requirements to process massive volumes of data
- Inability to unearth hidden insights due to siloed data initiatives
- Inability to marry various datasets together due to missing pieces around data standardization techniques
- Lack of user-friendly tools and techniques to discover, ingest, process, correlate, analyze, and consume the data
- Inability to experiment and innovate with agility and low cost
In this two-part series, I demonstrate a working solution with an AWS CloudFormation template for how a TSP can use existing data assets to generate new revenue streams and improve and personalize CX using AWS services. I also include key pieces of information around data standardization, baselining an analytics data model to marry different datasets in the data warehouse, self-service analytics, metadata search, and media dictionary framework.
In this post, you deploy the stack using a CloudFormation template and follow simple steps to transform, enrich, and bring multiple datasets together so that they can be correlated and queried.
In part 2, you learn how advanced business users can query enriched data and derive meaningful insights using Amazon Redshift and Amazon Redshift Spectrum or Amazon Athena, enable self-service analytics for business users, and publish ready-made dashboards via Amazon QuickSight.
Solution overview
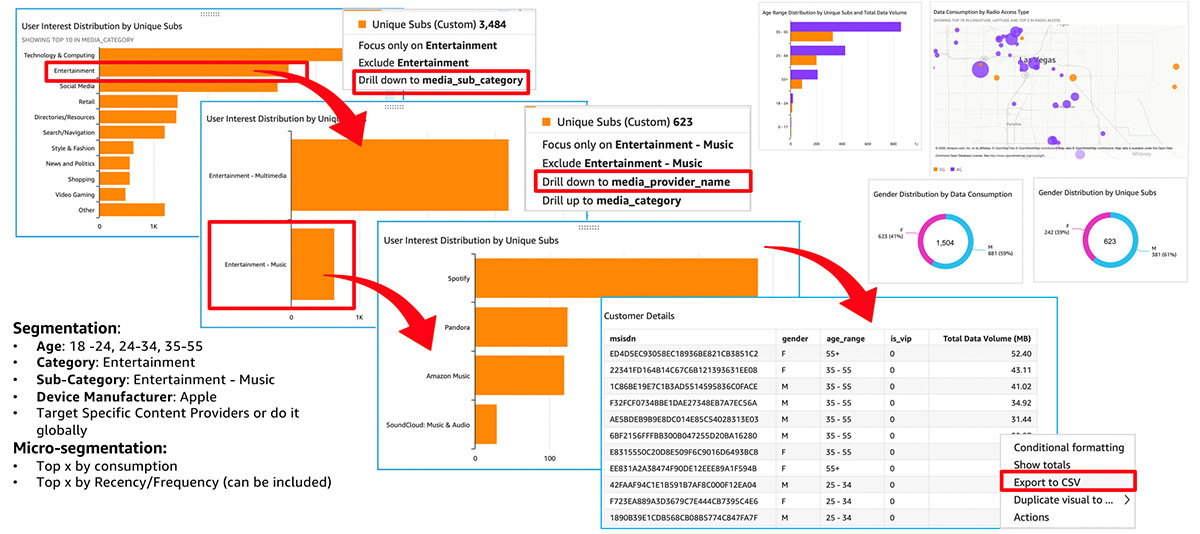
The main ingredient of this solution is Packet Switch (PS) probe data embedded with a deep packet inspection (DPI) engine, which can reveal a lot of information about user interests and usage behavior. This data is transformed and enriched with DPI media and device dictionaries, along with other standard telco transformations to deduce insights, profile and micro-segment subscribers. Enriched data is made available along with other transformed dimensional attributes (CRM, subscriptions, media, carrier, device and network configuration management) for rich slicing and dicing.
For example, the following QuickSight visualizations depict a use case to identity music lovers ages 18-55 with Apple devices. You can also generate micro-segments by capturing the top X subscribers by consumption or adding KPIs like recency and frequency.
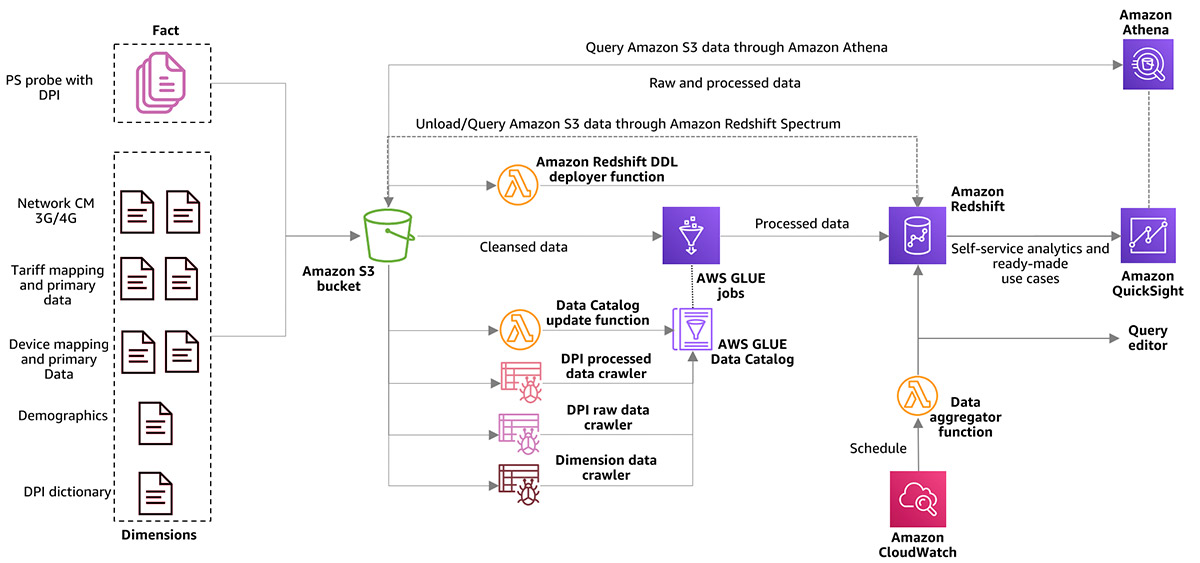
The following diagram illustrates the workflow of the solution.
For this post, AWS CloudFormation sets up the required folder structure in Amazon Simple Storage Service (Amazon S3) and provides sample data and dictionary file. Most of the data included as part of the CloudFormation template is dummy and is as follows:
- CRM
- Subscription and subscription mapping
- Network 3G & 4G configuration management
- Operator PLMN
- DPI and device dictionary
- PS probe data
Descriptions of all the input datasets and attributes are available with AWS Glue Data Catalog tables and as part of Amazon Redshift metadata for all tables in Amazon Redshift.
The workflow for this post includes the following steps:
- Catalog all the files in the AWS Glue Data Catalog using the following AWS Glue data crawlers:
- DPI data crawler (to crawl incoming PS probe DPI data)
- Dimension data crawler (to crawl all dimension data)
- Update attribute descriptions in the Data Catalog (this step is optional).
- Create Amazon Redshift schema, tables, procedures, and metadata using an AWS Lambda
- Process each data source file using separate AWS Glue Spark jobs. These jobs enrich, transform, and apply business filtering rules before ingesting data into an Amazon Redshift cluster.
- Trigger Amazon Redshift hourly and daily aggregation procedures using Lambda functions to aggregate data from the raw table into hourly and daily tables.
Part 2 includes the following steps:
- Catalog the processed raw, aggregate, and dimension data in the Data Catalog using the DPI processed data crawler.
- Interactively query data directly from Amazon S3 using Amazon Athena.
- Enable self-service analytics using QuickSight to prepare and publish insights based on data residing in the Amazon Redshift cluster.
The workflow can change depending on the complexity of the environment and your use case, but the fundamental idea remains the same. For example, your use case could be processing PS probe DPI data in real time rather than in batch mode, keeping hot data in Amazon Redshift, storing cold and historical data on Amazon S3, or archiving data in Amazon S3 Glacier for regulatory compliance. Amazon S3 offers several storage classes designed for different use cases. You can move the data among these different classes based on Amazon S3 lifecycle properties. For more information, see Amazon S3 Storage Classes.
Prerequisites
For this walkthrough, you should have the following prerequisites:
- An AWS account
- The
AdministratorAccessAWS Identity and Access Management (IAM) policy granted to your AWS account - The following AWS services:
- CloudFormation
- Amazon S3
- AWS Glue
- Amazon Redshift
- Lambda
- Athena
- QuickSight
- Amazon CloudWatch
- Amazon Secrets Manager
For more information about AWS Regions and where AWS services are available, see Region Table.
Creating your resources with AWS CloudFormation
To get started, create your resources with the following CloudFormation stack.
- Click the Launch Stack button below:

- Leave the parameters at their default, with the following exceptions:
- Enter RedshiftPassword and S3BucketNameParameter parameters, which aren’t populated by default.
- An Amazon S3 bucket name is globally unique, so enter a unique bucket name for S3BucketNameParameter.
The following screenshot shows the parameters for our use case.

- Choose Next.
- Select I acknowledge that AWS CloudFormation might create IAM resources with custom names.
- Choose Create stack.
It takes approximately 10 minutes to deploy the stack. For more information about the key resources deployed through the stack, see Data Monetization and Customer Experience(CX)Optimization using telco data assets: Amazon CloudFormation stack details. You can view all the resources on the AWS CloudFormation console. For instructions, see Viewing AWS CloudFormation stack data and resources on the AWS Management Console.
The CloudFormation stack we provide in this post serves as a baseline and is not a production-grade solution.
Building a Data Catalog using AWS Glue
You start by discovering sample data stored on Amazon S3 through an AWS Glue crawler. For more information, see Populating the AWS Glue Data Catalog. To catalog data, complete the following steps:
- On the AWS Glue console, in the navigation pane, choose Crawlers.
- Select DPIRawDataCrawler and choose Run crawler.
- Select DimensionDataCrawler and choose Run crawler.

- Wait for the crawlers to show the status Stopping.
The tables added against the DimensionDataCrawler and DPIRawDataCrawler crawlers should show 9 and 1, respectively.
- In the navigation pane, choose Tables.
- Verify the following 10 tables are created under the
cemdmdatabase:d_crm_demographicsd_deviced_dpi_dictionaryd_network_cm_3gd_network_cm_4gd_operator_plmnd_tacd_tariff_pland_tariff_plan_descraw_dpi_incoming
Updating attribute descriptions in the Data Catalog
The AWS Glue Data Catalog has a comment field to store the metadata under each table in the AWS Glue database. Anybody who has access to this database can easily understand attributes coming from different data sources through metadata provided in the comment field. The CloudFormation stack includes a CSV file that contains a description of all the attributes from the source files. This file is used to update the comment field for all the Data Catalog tables this stack deployed. This step is not mandatory to proceed with the workflow. However, if you want to update the comment field against each table, complete the following steps:
- On the Lambda console, in the navigation pane, choose Functions.
- Choose the GlueCatalogUpdate
- Configure a test event by choosing Configure test events.

- For Event name, enter
Test.

- Choose Create.
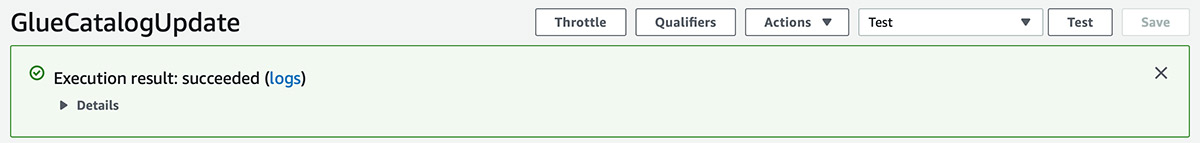
- Choose Test.
You should see a message that the test succeeded, which implies that the Data Catalog attribute description is complete.
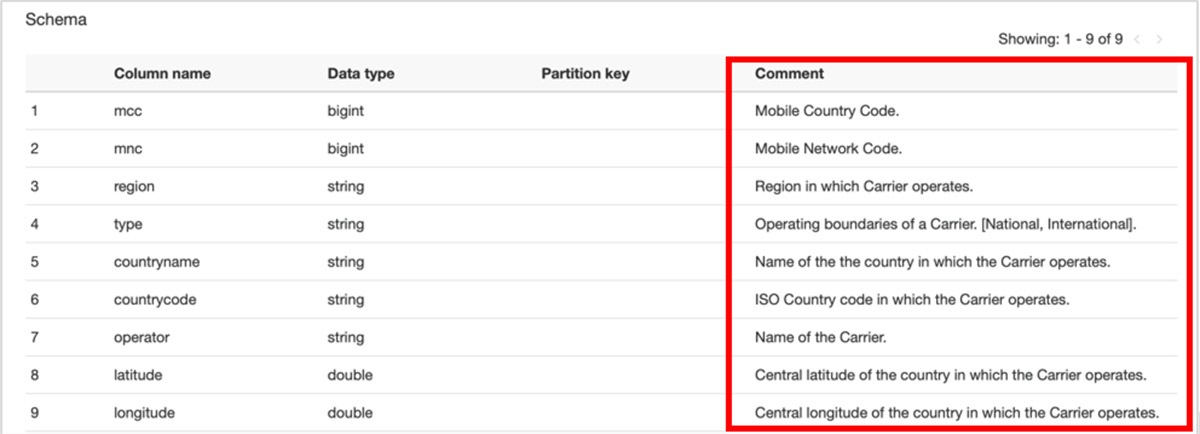
Attributes of the table under the Data Catalog database should now have descriptions in the Comment column. For example, the following screenshot shows the d_operator_plmn table.
Creating Amazon Redshift schema, tables, procedures, and metadata
To create schema, tables, procedures, and metadata in Amazon Redshift, complete the following steps:
- On the Lambda console, in the navigation pane, choose Functions.
- Choose the RedshiftDDLCreation
- Choose Configure test events.

- For Event name, enter
Test.

- Choose Create.
- Choose Test.
You should see a message that the test succeeded, which means that the schema, table, procedures, and metadata generation is complete.

Running AWS Glue ETL jobs
AWS Glue provides the serverless, scalable, and distributed processing capability to transform and enrich your datasets. To run AWS Glue extract, transform, and load (ETL) jobs, complete the following steps:
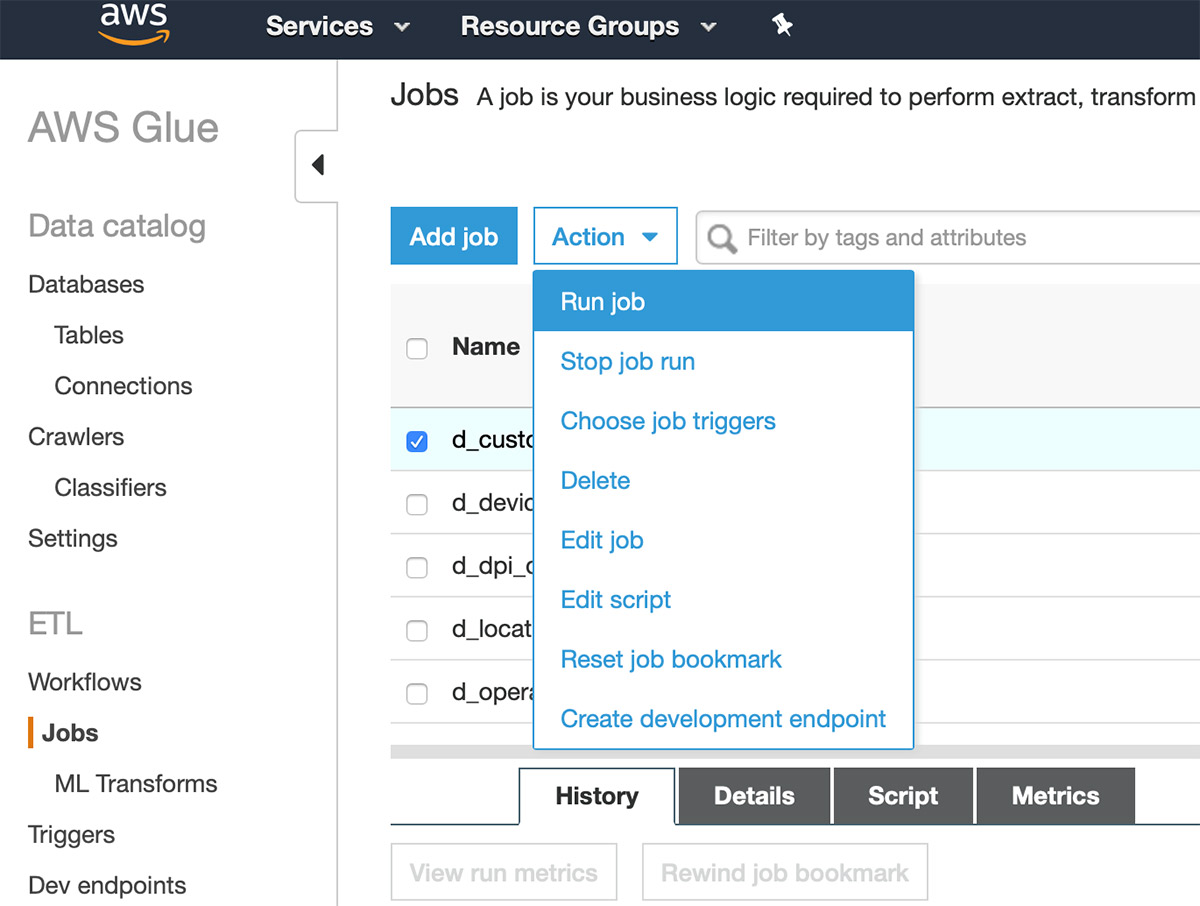
- On the AWS Glue console, in the navigation pane, choose Jobs.
- Select the following jobs (one at a time) and choose Run job from Action
d_customer_demographicsd_deviced_dpi_dictionaryd_locationd_operator_plmnd_tacd_tariff_pland_tariff_plan_descf_dpi_enrichment
You can run all these jobs in parallel.
All dimension data jobs should finish successfully within 3 minutes, and the fact data enrichment job should finish within 5 minutes.
- Verify the jobs are complete by selecting each job and checking Run status on the History tab.

Aggregating hourly and daily DPI data in Amazon Redshift
To aggregate hourly and daily sample data in Amazon Redshift using Lambda functions, complete the following steps:
- On the Lambda console, in the navigation pane, choose Functions.
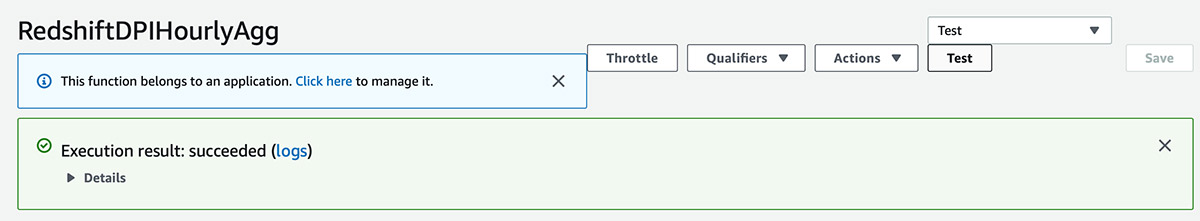
- Choose the RedshiftDPIHourlyAgg function.
- Choose Configure test events.

- For Event name, enter
Test.

- Choose Create.
- Choose Test.
You should see a message that the test succeeded, which means that hourly aggregation is complete.
- In the navigation pane, choose Functions.
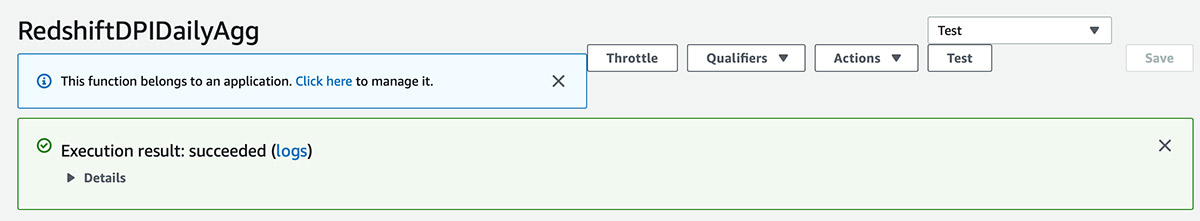
- Choose the RedshiftDPIDailyAgg function.
- Choose Configure test events.
- For Event name, enter
Test. - Choose Create.
- Choose Test.
You should see a message that the test succeeded, which means that daily aggregation is complete.
Both hourly and daily Lambda functions are hardcoded with the date and hour to aggregate the sample data. To make them generic, there are a few commented lines of code that need to be uncommented and a few lines to be commented. Both functions are also equipped with offset parameters to decide how far back in time you want to do the aggregations. However, this isn’t required for this walkthrough.
You can schedule these functions with CloudWatch. However, this is not required for this walkthrough.
So far, we have completed the following:
- Deployed the CloudFormation stack.
- Cataloged sample raw data by running
DimensionDataCrawlerandDPIRawDataCrawlerAWS Glue crawlers. - Updated attribute descriptions in the AWS Glue Data Catalog by running the
GlueCatalogUpdateLambda function. - Created Amazon Redshift schema, tables, stored procedures, and metadata through the
RedshiftDDLCreationLambda function. - Ran all AWS Glue ETL jobs to transform raw data and load it into their respective Amazon Redshift tables.
- Aggregated hourly and daily data from enriched raw data into hourly and daily Amazon Redshift tables by running the
RedshiftDPIHourlyAggandRedshiftDPIDailyAggLambda functions.
Cleaning up
If you don’t plan to proceed to the part 2 of this series, and want to avoid incurring future charges, delete the resources you created by deleting the CloudFormation stack.
Conclusion
In this post, I demonstrated how you can easily transform, enrich, and bring multiple telco datasets together in an Amazon Redshift data warehouse cluster. You can correlate these datasets to produce multi-dimensional insights from several angles, like subscriber, network, device, subscription, roaming, and more.
In part 2 of this series, I demonstrate how you can enable data analysts, scientists, and advanced business users to query data from Amazon Redshift or Amazon S3 directly.
Post Syndicated from Vikas Omer original https://aws.amazon.com/blogs/big-data/part-1-data-monetization-and-customer-experience-optimization-using-telco-data-assets/
Source: https://noise.getoto.net/2021/01/26/data-monetization-and-customer-experience-optimization-using-telco-data-assets-part-1/ – 27 01 21


