Archive | HSPA and HSPA+ RSS feed for this section

WiMAX vs. LTE vs. HSPA+: who cares who wins?

2 Oct

Who cares who wins the 4G cup?

“We must stop the confusion about which technology is going to win; it achieves nothing positive and risks damage to the entire industry.”

Anyone among the curious band of people who track articles about the status of mobile broadband (and the chances are that you are one of them) will have noticed an interesting trend over the past 18 months: the temperature of the debate about the technology most likely to succeed is rising rapidly. Increasingly polarised articles are published on a daily basis, each arguing that Long Term Evolution (LTE) is the 4G technology of choice, or that WiMAX is racing ahead, or that it’s best to stick with good old 3GPP because HSPA+ is going to beat both of them. It remains surprising that their articles invite us, their readers, to focus slavishly on the question “WiMAX vs. LTE vs. HSPA+: which one will win?”

The question that we should ask of the authors is “Who cares who wins?” The torrent of propaganda washes over the essence of mobile broadband and puts sustained growth in the mobile industry at risk. By generating fear, uncertainty and doubt, the mobile broadband “battle” diverts attention away from the critical issues that will determine the success or failure of these evolving technologies.  The traditional weapon of the partisan author is the mighty “Mbps”; each wields their peak data rates to savage their opponents.

In the HSPA+ camp, authors fire out theoretical peak data rates of 42Mbps DL and 23 Mbps UL. The WiMAX forces respond with theoretical peak data rates of 75Mbps DL and 30Mbps UL. LTE joins the fray by unleashing its theoretical peak data rates of 300Mbps DL and 75 Mbps UL. All hell breaks loose, or so it would appear. Were it not for the inclusion of the word “theoretical”, we could all go home to sleep soundly and wake refreshed, safe in the knowledge that might is right. The reality is very different.

Sprint has stated that it intends to deliver services at between 2 and 4 Mbps to its customers with Mobile WiMAX. In the real world, HSPA+ and LTE are likely to give their users single digit Mbps download speeds.  Away from the theoretical peak data rates, the reality is that the technologies will be comparable with each other, at least in the experience of the user. These data rates, from a user’s perspective, are a great improvement on what you will see while sitting at home on your WiFi or surfing the web while on a train. The problem is that the message being put out to the wider population has the same annoying ringtone as those wild claims that were made about 3G and the new world order that it would usher in. Can you remember the allure of video calls? Can you remember the last time you actually saw someone making a video call?

3G has transformed the way that people think about and use their mobile phones, but not in the way that they were told to expect. In the case of 3G, mismanagement of customer expectations put our industry back years. We cannot afford to repeat this mistake with mobile broadband. Disappointed customers spend less money because they don’t value their experience as highly as they had been led to expect by advertisers.  Disappointed customers share their experience with friends and family, who delay buying into the mobile broadband world.  What we all want are ecstatic customers who can’t help but show off their device. We need to produce a ‘Wow’ factor that generates momentum in the market.

Every pundit has a pet theory about the likely deployment of mobile broadband technologies. One will claim that HSPA+ might delay the deployment of LTE. Another will posit that WiMAX might be adopted, predominantly, in the laptop or netbook market. A third will insist that LTE could replace large swathes of legacy technologies.  These scenarios might happen, but they might not, too.

More likely, but less stirring, is the prediction that they are all coming, they’ll be rolled out to hundreds of millions of subscribers and, within five years, will be widespread. We must stop the confusion about which technology is going to win; it achieves nothing positive and risks damage to the entire industry.

Confusion unsettles investors, who move to other markets and starve us of the R&D funds needed to deliver mobile broadband. At street level, confusion leads early adopters to hold off making commitments to the new wave of technology while they “wait it out” to ensure they don’t buy a Betamax instead of a VHS.  Where we should focus, urgently, is on the two topics that demand open discussion and debate. First, are we taking the delivery of a winning user experience seriously? Secondly, are we making plans to cope with the data tidal wave that will follow a successful launch?

The first topic concerns delivery to the end user of a seamless application experience that successfully converts the improved data rates to improvements on their device. This can mean anything from getting LAN-like speeds for faster email downloads through to slick, content-rich and location-aware applications. As we launch mobile broadband technologies, we must ensure that new applications and capabilities are robust and stable. More effort must be spent developing and testing applications so that the end user is blown away by their performance.

The second topic, the tidal wave of data, should force us to be realistic about the strain placed on core networks by an exponential increase in data traffic. We have seen 10x increases in traffic since smartphones began to boom. Mobile device makers, network equipment manufacturers and application developers must accept that there will be capacity shortages in the short term and, in response, must design, build and test applications rigorously. We need applications with realistic data throughput requirements and the ability to catch data greedy applications before they reach the network.

In Anite, we see the demands placed on test equipment by mobile broadband technologies at first hand. More than testing the technical integrity of the protocol stack and its conformance to the core specifications, we produce new tools that test applications and simulate the effects of anticipated capacity bottlenecks. Responding to the increased demand for mobile applications, we’re developing test coverage that measures applications at the end-user level. Unfortunately, not everyone is thinking that far ahead. Applications that should be “Wow”, in theory, may end up producing little more than a murmur of disappointment in the real world.

So, for the sake of our long-term prospects, let’s stop this nonsense about how one technology trounces another. Important people, the end users, simply do not care.  WiMAX, LTE and HSPA+ will all be widely deployed. As an industry, our energy needs to be focused on delivering services and applications that exceed the customer expectations.  Rather than fighting, we should be learning from each other’s experiences.  If we do that, our customers will reward us with growing demand. If we all get sustained growth, then don’t we all win..?

Source: http://www.telecoms.com/11695/wimax-vs-lte-vs-hspa-who-cares-who-wins/

CQI – Channel Quality Indicator

2 Feb

CQI

CQI stands for Channel Quality Indicator. As the name implies, it is an indicator carrying the information on how good/bad the communication channel quality is. This CQI is for HSDPA. (LTE also has CQI for its own purpose).

CQI is the information that UE sends to the network and practically it implies the following two

i) Current Communication Channel Quality is this-and-that..

ii) I (UE) wants to get the data with this-and-that transport block size, which in turn can be directly converted into throughput

Followings are the topics that I will talk about in this page.

  
What would happen if UE send inaccurate CQI ?

In HSDPA, the CQI value ranges from 0 ~ 30. 30 indicates the best channel quality and 0,1 indicates the poorest channel quality. Depending which value UE reports, network transmit data with different transport block size. If network gets high CQI value from UE, it transmit the data with larger transport block size and vice versa.

What if network sends a large transport block even though UE reports low CQI, it is highly probable that UE failed to decode it (cause CRC error on UE side) and UE send NACK to network and the network have to retransmit it which in turn cause waste of radio resources.

What if UE report high CQI even when the real channel quality is poor ? In this case, network would send a large transport block size according to the CQI value and it would become highly probable that UE failed to decode it (cause CRC error on UE side) and UE send NACK to network and the network have to retransmit it which in turn cause waste of radio resources.

How UE estimate CQI ?

How UE can measure CQI ? This is the most unclear topic to me. As far as I know, there is no explicit description in any standard on the mechanism by which the CQI is calculated, but it is pretty obvious that the following factors play important roles to CQI measurement.

  • signal-to-noise ratio (SNR)
  • signal-to-interference plus noise ratio (SINR)
  • signal-to-noise plus distortion ratio (SNDR)

It is not defined in the specification on how these factors are used and whether there is any other factors being involved. The implementation is all up to chipset makers. In most case, the chipset maker derives a complicated mathemtical formula called channel model and derive SNR/SINR/SNDR from the channel model. And then, they do a lot of testing to correlate the measured SNR and the measured BLER by the chipset and create some internal table (or equation) for the correlation. And the mapping table(function) would eventually used to determine CQI value.

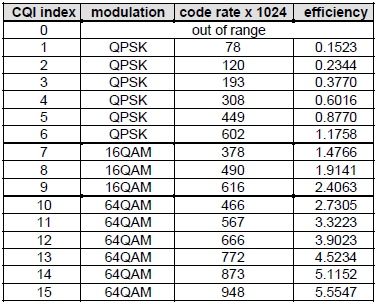
CQI Value and Expected PDSCH Modulation Scheme

In LTE, there are 15 different CQI values randing from 1 to 15 (4 bits) and mapping between CQI and modulcation scheme, transport block size is defined as follows (36.213)


< 36.213 Table 7.2.3-1 >

< 36.213 Table 7.2.3-2 >

If you are an engineer in Network (eNodeB) programming, you need to know the number of resource blocks and MCS for each CQI value to properly allocate the resources for each of UEs. With the modulation scheme in the table, you would get a certain range of MCS you can use for each CQI index. But you cannot pinpoint a specific MCS and Number of RBs. You need another condition to get the proper MCS and N RBs and it is ‘Code Rate‘ shown in the table. But still there is not a single formula that would give you a single/determined value for MCS and NRB. You have to come up with a set of MCS and N RB that meet the modulation scheme and Code Rate requirement in the table. One example case can be as follows.

CQI

Modulation

Bits/Symbol

REs/PRB

N_RB

MCS

TBS

Code Rate

1

QPSK

2

138

20

0

536

0.101449

2

QPSK

2

138

20

0

536

0.101449

3

QPSK

2

138

20

2

872

0.162319

4

QPSK

2

138

20

5

1736

0.318841

5

QPSK

2

138

20

7

2417

0.442210

6

QPSK

2

138

20

9

3112

0.568116

7

16QAM

4

138

20

12

4008

0.365217

8

16QAM

4

138

20

14

5160

0.469565

9

16QAM

4

138

20

16

6200

0.563768

10

64QAM

6

138

20

20

7992

0.484058

11

64QAM

6

138

20

23

9912

0.600000

12

64QAM

6

138

20

25

11448

0.692754

13

64QAM

6

138

20

27

12576

0.760870

14

64QAM

6

138

20

28

14688

0.888406

15

64QAM

6

138

20

28

14688

0.888406

Note 1 : Refer to Throughtput Calculation Example for determining N_RB, MCS, TBS determination.

Note 2 : REs/PRB varies depending on CFI value as follows.

CFI

REs/PRB

1

150

2

138

3

126

Note 3 : I used the following formula explained in Code Rate section.

v_CodingRate := (int2float(p_TBSize + 24)) / (int2float(p_N_PRB * tsc_REs_Per_PRB * v_BitsPerSymbol));

CQI vs SNR


As mentioned earlier, the main criteria for UE to determined CQI value is SNR, but the exact mapping between the measured SNR and CQI may vary a little depending on each modem manufacturer, but overall correlation between CQI and SNR would be similar. Every modem manufacturer would keep their own mapping table in their physical layer protocol stack but in most case the venders would not open those tables in public. Fortunally, I found a data from Ref [3] as follows. This example would give you a concrete insight about CQI determination.

Following is the description of each of the traces shown in the graph.

  • 111 Tx Mode 0 re-tx:TM1, Number of Tx Antenna = 1, Number of Rx Antenna = 1, HARQ  Max retransmission = 0
  • 111 Tx Mode 3 re-tx:TM1, Number of Tx Antenna = 1, Number of Rx Antenna = 1, HARQ  Max retransmission = 3
  • 222 Tx Mode:TM2, Number of Tx Antenna = 2, Number of Rx Antenna = 2
  • 322 Tx ModeTM3, Number of Tx Antenna = 2, Number of Rx Antenna = 2
  • 342 Tx Mode:TM3, Number of Tx Antenna = 4, Number of Rx Antenna = 2

Following is the same data as shown in the above graph, but summarized in tabular format.

Which Physical Channel Carriers CQI Value ?

CQI is carried by PUCCH or PUSCH depending on the situation as follows.

  • Carried by PUCCH : Periodic CQI
  • Carried by PUSCH : Aperiodic CQI (and Periodic CQI)


Regarding CQI report period and configuration, refer to CQI, PMI, RI Reporting Configuration part.


Two Important CQI Table


We have two different tables as shown below defined in 36.213. Now the question is in which situation the first table (Table 7.2.3-1) is used and in which situation the second table(Table 7.2-1) is used). Overall story is described in 36.213 section 7.2, I will just re-organize those statements in a little bit different structure.

The table shown above is used in following situation. In this table, 4 bit is used to indicate each CQI value.

1) For transmission modes 1, 2, 3 and 5, as well as transmission modes 8, 9 and 10 without PMI/RI reporting, transmission mode 4 with RI=1, and transmission modes 8, 9 and 10 with PMI/RI reporting and RI=1

2) For RI > 1 with transmission mode 4, as well as transmission modes 8, 9 and 10 with PMI/RI reporting, PUSCH based triggered reporting. In this case, one out of the 4 bit CQI (16 different value) is reported for each Codeword (CW0 and CW1).


Following is another table that is used for CQI report, but this is not the absolute value. It is a different value for two different CQI value. Then.. how this difference is defined ? It is defined as follows :

Codeword 1 offset level = wideband CQI index for codeword 0 – wideband CQI index for codeword 1.


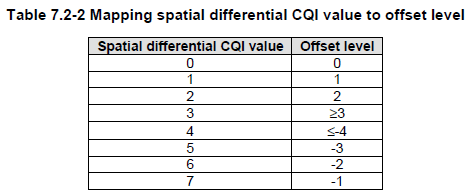
This table is used in following case :

1) For RI > 1 with transmission mode 4, as well as transmission modes 8, 9 and 10 with PMI/RI reporting, PUCCH based reporting includes reporting a 4-bit wideband CQI for codeword 0 according to Table 7.2.3-1 and a wideband spatial differential CQI


CQI Report and DRX


When you configure/enable CQI report, you need to take into consideration of other type of periodic acitivties that might be happening in UE. The most typicial type of periodic activities you have to consider is DRX(C-DRX : Connected Mode DRX).


There are a couple of points in 3GPP specification that you may refer to are as follows :


36.321 V11.5.0-5.7 Discontinuous Reception (DRX) states as follows :


if CQI masking (cqi-Mask) is setup by upper layers:

in current subframe n, if onDurationTimer would not be running considering grants/assignments/DRX Command MAC control elements received until and including subframe n-5 when evaluating all DRX Active Time conditions as specified in this subclause, CQI/PMI/RI/PTI on PUCCH shall not be reported.

– else:

in current subframe n, if the UE would not be in Active Time considering grants/assignments/DRX Command MAC control elements received and Scheduling Request sent until and including subframe n-5 when evaluating all DRX Active Time conditions as specified in this subclause, CQI/PMI/RI/PTI on PUCCH shall not be reported.


Simply put, this means ‘If CDRX is eanbled and UE is in sleeping mode due to CDRX acitivity, UE shall not send CSI(CQI /PMI /RI).

CQI Report and SR


Since CQI (especially periodic CQI) is carried by PUCCH, you need to consider another information that is carried by PUCCH. One important case you need to take into account is SR (Scheduling Request).


36.213 V12.7.0 – 7.2.2 Periodic CSI Reporting using PUCCH states as follows :


If the UE is not configured for simultaneous PUSCH and PUCCH transmission or, if the UE is configured for simultaneous PUSCH and PUCCH transmission and not transmitting PUSCH, in case of collision between CSI and positive SR in a same subframe, CSI is dropped.


It means .. if there is a case where UE needs to send both SR and CQI, SR transmission has higher priority and CQI gets dropped.

How Network(eNB) trigger UE to send CSI ?


I hope you got the general picture of CQI by now. Now a question that comes to your mind would be how the network trigger UE to send CQI (in other words, when UE is supposed to send CSI. CQI is a kind of CSI. So I would explain on triggering CSI here).

There are roughly two types of CQI triggering mechanism (i.e, Periodic and Aperiodic) and the detailed procedure are a little bit different between these two types.

  • Periodic Report : In this mode, UE is supposed to send CQI report periodically with a specified interval. The interval and specific subframe a UE is supposed to send the report is specified in RRC message. (Refer to CQI, PMI, RI Reporting Configuation-Details on Periodic Report for the details).
  • Aperiodic Report : In this mode, UE is supposed to send CSI report only when it gets a specific trigger from the network. What do you mean by ‘specific trigger’ ?  It means ‘CSI Request field in DCI 0’. It means the direct trigger for Aperiodic CSI is DCI 0(UL Grant). However, this direct trigger is not enough for the UE. UE has to know what kind of CSI it should report (e.g, CQI only ? CQI and PMI ? CQI and PMI and RI ?). what about the case of carrier aggregation ? Do I (UE) have to report for PCC ? or SCC? or both PCC and SCC ? All of these detailed informations is configured by RRC message(Refer to CQI, PMI, RI Reporting Configuation-Details on Aperiodic Report and CQI/RI Feedback type for the details)

How to test CQI ?

How can we test CQI report functionality ? There are roughly two different types of test method. (The word ‘type’ is my personal expression.. it is not 3GPP term. Don’t try to look for ‘CQI test Type 1’ or ‘Type 2’ in 3GPP document 🙂


< Type 1 : Live Network Behavior Test >


The first type may not be an accurate test for UE’s CQI report functionality, but it is closer to live network behavior. Overall sequence of CQI report and eNB reaction to the report is as follows :

    • i) UE sends a CQI report with a certain value (e.g, 15)
    • ii) eNB sends PDSCH with the highest MCS (i.e, the highest code rate and the largest transport block)
    • iii) If UE can successfully decode it (meaning BLER lower than a certain limit), it sends the same or higher CQI.

If UE fail to decode it(meaning BLER higher than a certain limit), it sends the CQI less than the previous one

  • iv) eNB sends PDSCH with the lower MCS(i.e, the lower code rate and the smaller transport block)
  • v) go to step iii)

With this procedure, eNB can transmit PDSCH with the code rate (MCS) that can be successfully decoded by UE (i.e, causing no CRC/no BLER).


Following is one example of CQI report and throughput change based on Radio Channel Quality between a UE and LTE Network Simulator from Amarisoft. It configures CQI configuration as follows by default. (If you are not familiar with the meaning of these parameters, refer to CQI Report Configuration page)

cqi-ReportConfig {

  nomPDSCH-RS-EPRE-Offset 0,

  cqi-ReportPeriodic setup: {

    cqi-PUCCH-ResourceIndex 0,

    cqi-pmi-ConfigIndex 38,

    cqi-FormatIndicatorPeriodic widebandCQI: NULL,

    simultaneousAckNackAndCQI FALSE

  }

},

First I get UE camped on the LTE Simulator with a good radio channel and start downloading YouTube from the UE. While UE is downloading YouTube video, I changed cell power (Downlink Power) step by step. The upper plot is cell power change and the average CQI (Average of 50 subframes) in reaction to the cell power change and lower plot shows the throughput change in accordance to CQI changes. This throughput change is because eNB assigns different MCS in response to CQI report. Amarisoft WebInterface Logging/Analysis tool allow us to get this kind of graph with a couple of button click.


CQI report is carried by different channels (PUCCH or PUSCH) and in different format (e.g, PUCCH format 2 or 2A etc) depending on situation. Amarisoft logging captures all the PUCCH and PUSCH information as shown below.


< Type 2 : RF Conformance Test : CQI Measurement Accuracy Test >


Another type of CQI testing can be more accurate test for UE’s CQI report capability (but you wouldn’t see this kind of behavior in live network). Briefly speaking the overall procedure is as follows.

  • i) eNB sends a PDSCH with the condition for a certain CQI (e.g, CQI 8)
  • ii) UE sends a CQI report with a certain value (e.g, CQI 6)
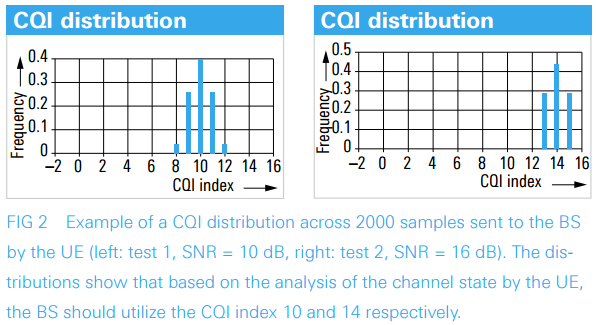
  • iii) (if it is live network, eNB would send PDSCH with MCS corresponding to CQI 6, but) eNB sends PDSCH with the same CQI (same MCS) regardless of the CQI value from UE.
  • iv) Repeat this process many times (e.g, 2000 times) and calculate statistical distribution plot (e.g, histogram) using the CQI values from UE.

More accurately, you may refer to the test procedure described in 3GPP 36.521. Chapter 9 of 36.521-1 is all about CQI report test. There are many test cases in the chapter but test procedure are similar for all the test cases. They do the similar procedure with various different channel condition.  A most typical procedure is described as below.


36.521-1 9.2.1.1.4.2 Test procedure


The SS shall transmit PDSCH via PDCCH DCI format 1A for C_RNTI to transmit the DL RMC according to CQI value 8 and keep it regardless of the wideband CQI value sent by the UEThe SS sends downlink MAC padding bits on the DL RMC. Continue transmission of the PDSCH until 2000 wideband CQI reports have been gathered. In this process the SS collects wideband CQI reports every 5 ms and also cases where UE transmits nothing in its CQI timing are also counted as wideband CQI reports.


< 36.521-1 Table 9.2.1.1.4.3-1: PhysicalConfigDedicated-DEFAULT >

< 36.521-1 Table 9.2.1.1.4.3-2: CQI-ReportConfig-DEFAULT >

Main purpose of this test is to check the accuracy of UE’s CQI report (i.e, to check how accurantely UE estimate the radio channel condition and send the corresponding CQI report). Following is an example of test results shown in Reference 2.

CQI Measurement in Livenetwork


The final goal of designing the concept of CQI and implementing it in such a complicated (confusing way) is to achieve the least amount of error and the best possible rate of throughput. There are many factors influencing the throughput and each of the factors would have some kind of correlations with other factors. In Lab test, it is relatively easy to figure out those correlations since you can control those factors (parameters) as fitting the best for analysis, but in live network it is not always that easy to figure out those correlations because most of those factors (parameters) changes dynamically. So the livenetwork test result would not be easily explainable but I think it always good to have some level of experience with livenetwork test result.

General rule of thumb for the correlation between CQI and throughput can be summarized as follows.

  • i) High throughput does not necessarily mean high CQI. (High throughput depends not only on CQI, but also on transport block size (Number of RB and MCS. Even when CQI is high, eNB may assign small resources due to various other factors)
  • ii) Low throughput does not necessarily mean low CQI. (The reason is same as above)
  • iii) With low CQI, it is for sure that you cannot achieve the maximum throughput. So, it is very likely that you would see low CQI when you see throughput drop in livenetwork test.

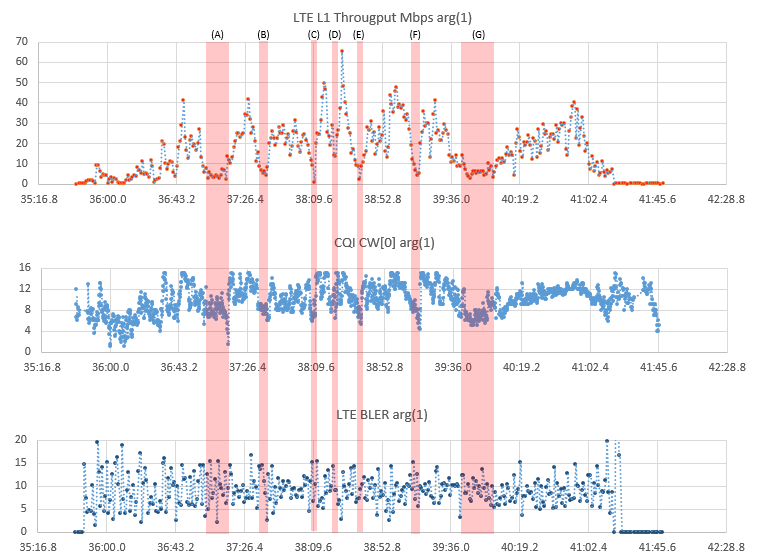
Example 1 > Throughput, CQI, BLER while driving on a highway


Following plot is from the data captured by a drive test tool Azenqos Drive Test tool (AZQ Android). I got the log captured by the tool and exported the data as csv file and then plot it on Microsoft Excel. As mentioned above, you would not get always high throughput whever you have high CQI, but it is very likely to see low CQI when you see throughput dips (drops) as marked in shaded box.

One thing I notice from this specific example is that BLER is a little bit higher than I expected. As mentioned above, one of the main goal of CQI design/implementation is to minimize the BLER, but I think the BLER in this log seems to be a little bit too high. If this result is only for a specific UE, it might be the UE issue. However, this kind of result is observed for most of the UE tested in that area, it would be good to optimize the network parameters for that area.


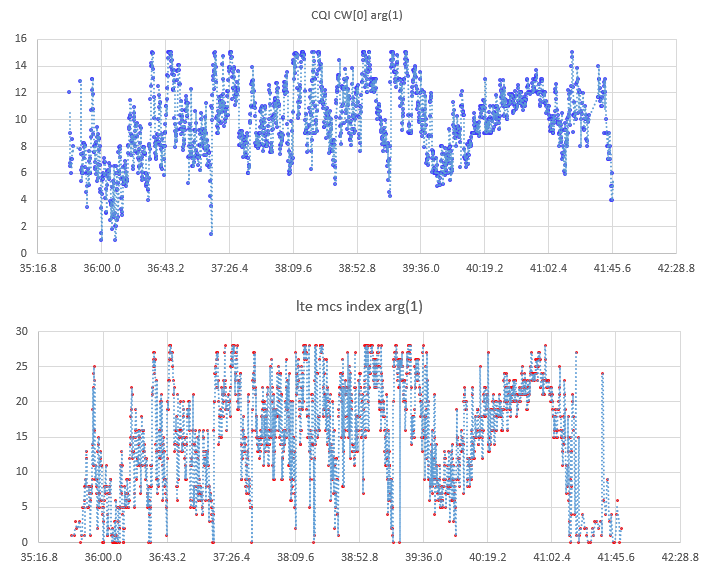
Example 2 > CQI vs MCS

Following plot is from the data captured by a drive test tool Azenqos Drive Test tool (AZQ Android). I got the log captured by the tool and exported the data as csv file and then plot it on Microsoft Excel.

Even in live network measurement, you may see pretty obvious correlation between CQI and MCS. This should be relatively obvious because network changes MCS dynamically based on CQI to minimize the MCS.


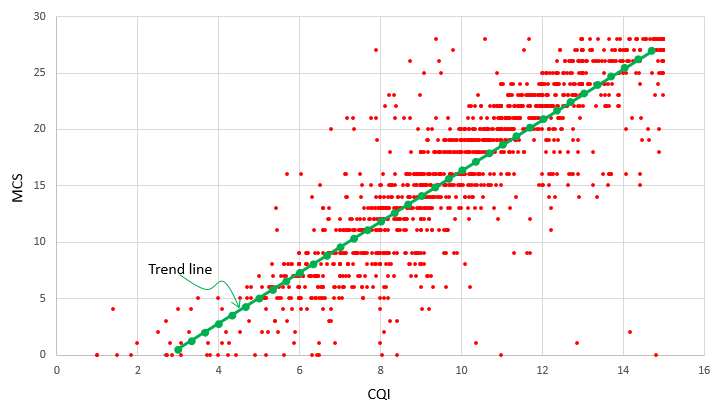
The correlation between CQI and MCS would be more obvious if you plot the data in a scatter plot as shown below. Even though the data points are scattered around you may say it is relatively well aligned along a straight line (the green line). Of course it would be better to have those points spread less.

Source: http://www.sharetechnote.com/html/Handbook_LTE_CQI.html – update 28 05 21

A few simple tips to boost the battery life on your smartphone

9 Jul

Note: The ability to perform some of these actions may depend on the type of phone you are using and what operating system it employs (whether it be Android, iOS, BlackBerry, or Windows Phone). Check with your phone’s users guide to find the exact instructions on how to perform these actions.

Lower your screen brightness

Most devices automatically adjust the screen brightness depending on ambient lighting, but you can override this by manually changing the brightness in your device’s settings app (you may need to uncheck automatic brightness). Slide the brightness to the left or right until you find a setting that is dim but still comfortable to your eyes.

Turn on Power Saving mode

Most of today’s devices have a power saving mode built in for those times when you need to squeeze and extra bit of juice out of your phone. On the majority of devices this will limit the processor speed and number of cores used, lower the performance of the graphics processor, dim the screen, and turn off some extra features like haptic feedback.

Turn off Haptic Feedback

Haptic Feedback uses the vibration feature of your phone to provide you with physical feedback when you touch things on the screen. One of the biggest areas where you can feel this in action is with the keyboard. Every time you press a key, the phone will make a slight vibration. If you do a fair amount of typing on your phone then this can slightly impact your battery life.

If the power saving mode on your phone doesn’t turn off haptic feedback for you, or if you don’t like using your phones power saving mode for whatever reason (because it limits performance for example), then turn off haptic feedback on its own.

Use a dark wallpaper (for devices with AMOLED displays)

AMOLED displays are unique in that when a pixel is black it is turned completely off, therefore drawing less power (in comparison to a traditional LCD panel where all of the pixels are constantly on). If your device has an AMOLED screen (like many of Samsung’s high-end Galaxy series or the BlackBerry Q10 for example), set your wallpaper to something a bit darker. It’ll help save power and you’ll channel your inner vampire too!

Close background apps

Apps use processing power and consume memory, even if they’re just sitting in the background. If you’re trying to conserve battery life, make sure that you close any apps that might be running in the background to free up memory and lower processor usage.

Use Wi-Fi for data when cellular reception is poor

Your phone uses more power when you are in a poor reception area since it needs to work harder to maintain a connection to your carrier’s tower. If your phone is syncing data every half an hour and you’re browsing the Internet over a poor connection it is going to drain your battery faster than if you were in an area with great reception. You’re better off to turn Wi-Fi on and connect to a local network if at all possible, which will provide you with a faster connection and help save battery life too.

Use HSPA/HSPA+ instead of 4G LTE

4G LTE provides blazing fast data speeds and low latency. It does however use more battery, especially if you’re inside where the signal isn’t quite as strong as HSPA (since LTE frequencies use don’t penetrate through concrete and other building materials well, and your phone has to work harder to maintain the signal as mentioned above).

If you need to save battery life and can sacrifice a bit of speed, drop your connection back to HSPA/HSPA+. To do this on a Samsung Galaxy for example, you would navigate to Settings > More networks > Mobile networks > Network mode, and change the network mode to “GSM/WCDMA” or “GSM/HSPA” (the labeling can be different depending on your phone).

Note: The ability to change the network mode may depend on your carrier and the type of device you are using. As mentioned before, check your users manual for exact instructions.

Top up instead of running your battery flat

Back in the day rechargeable batteries were based on something known as Ni-Cad, which suffered from a memory effect. This meant that if you constantly drained your battery to 60% and back up to 100%, you’d eventually lose over half of your battery’s capacity.

Today’s devices use a technology called Lithium Ion, which does not suffer from this effect. However it’s still possible to wear out a Li-On battery by putting it through many charge cycles.

charge cycle is essentially when you take a battery that is fully charged, completely drain it, and then charge it back up again. This wears out the battery over time and you’ll find that the capacity of the battery will begin to diminish.

With Li-On batteries, it’s better to “top up” when possible. So if your battery is at 50% at the end of the day, plug it in over night before you go to sleep and let it charge back up. By doing this, you’re only consuming half of a charge cycle and pro-longing the life of your battery.

Why is this so important? More and more devices today are coming with non-removable batteries (such as Apple’s iPhone and HTC’s One), and replacing thee battery can be expensive since the phone needs to be physically disassembled to do so.

Source: http://krsnxkenn.wordpress.com/2013/07/08/a-few-simple-tips-to-boost-the-battery-life-on-your-smartphone/

iPhone 5 gets faster internet speed after the update hack on T-mobile

12 May

Technology news

Apple has always opposed jailbreaking or making any changes in the iPhones but after the current hack, they may change their mind. The folks from tmonews hacked the carrier update for T-mobile ,boosting the internet speed on iPhone by 3mbps to 8 mbps. The hacked update works on locked or unlocked iPhone 5 and also for unlocked AT&T iPhone mobiles.

The update set the band preference for HSPA+, even if your iPhone 5 doesn’t support it, to AWS which can cause conflictions and problems for the devices that don’t support that band.

For those with an iPhone 5 that supports AWS, this hack will also help you as well as it will connect to the strongest tower (PCS and AWS) rather than the preferred type of tower.

AWSspeedtestbeforeafter

So,if you are on T-mobile and on 1900Mhz spectrum then get the update and enjoy the new speedy internet on your iPhone5. The…

View original post 29 more words

WiMAX vs. LTE vs. HSPA+: who cares who wins?

6 Feb

Who cares who wins the 4G cup?

“We must stop the confusion about which technology is going to win; it achieves nothing positive and risks damage to the entire industry.”

Anyone among the curious band of people who track articles about the status of mobile broadband (and the chances are that you are one of them) will have noticed an interesting trend over the past 18 months: the temperature of the debate about the technology most likely to succeed is rising rapidly. Increasingly polarised articles are published on a daily basis, each arguing that Long Term Evolution (LTE) is the 4G technology of choice, or that WiMAX is racing ahead, or that it’s best to stick with good old 3GPP because HSPA+ is going to beat both of them. It remains surprising that their articles invite us, their readers, to focus slavishly on the question “WiMAX vs. LTE vs. HSPA+: which one will win?”

The question that we should ask of the authors is “Who cares who wins?” The torrent of propaganda washes over the essence of mobile broadband and puts sustained growth in the mobile industry at risk. By generating fear, uncertainty and doubt, the mobile broadband “battle” diverts attention away from the critical issues that will determine the success or failure of these evolving technologies.  The traditional weapon of the partisan author is the mighty “Mbps”; each wields their peak data rates to savage their opponents.

In the HSPA+ camp, authors fire out theoretical peak data rates of 42Mbps DL and 23 Mbps UL. The WiMAX forces respond with theoretical peak data rates of 75Mbps DL and 30Mbps UL. LTE joins the fray by unleashing its theoretical peak data rates of 300Mbps DL and 75 Mbps UL. All hell breaks loose, or so it would appear. Were it not for the inclusion of the word “theoretical”, we could all go home to sleep soundly and wake refreshed, safe in the knowledge that might is right. The reality is very different.

Sprint has stated that it intends to deliver services at between 2 and 4 Mbps to its customers with Mobile WiMAX. In the real world, HSPA+ and LTE are likely to give their users single digit Mbps download speeds.  Away from the theoretical peak data rates, the reality is that the technologies will be comparable with each other, at least in the experience of the user. These data rates, from a user’s perspective, are a great improvement on what you will see while sitting at home on your WiFi or surfing the web while on a train. The problem is that the message being put out to the wider population has the same annoying ringtone as those wild claims that were made about 3G and the new world order that it would usher in. Can you remember the allure of video calls? Can you remember the last time you actually saw someone making a video call?

3G has transformed the way that people think about and use their mobile phones, but not in the way that they were told to expect. In the case of 3G, mismanagement of customer expectations put our industry back years. We cannot afford to repeat this mistake with mobile broadband. Disappointed customers spend less money because they don’t value their experience as highly as they had been led to expect by advertisers.  Disappointed customers share their experience with friends and family, who delay buying into the mobile broadband world.  What we all want are ecstatic customers who can’t help but show off their device. We need to produce a ‘Wow’ factor that generates momentum in the market.

Every pundit has a pet theory about the likely deployment of mobile broadband technologies. One will claim that HSPA+ might delay the deployment of LTE. Another will posit that WiMAX might be adopted, predominantly, in the laptop or netbook market. A third will insist that LTE could replace large swathes of legacy technologies.  These scenarios might happen, but they might not, too.

More likely, but less stirring, is the prediction that they are all coming, they’ll be rolled out to hundreds of millions of subscribers and, within five years, will be widespread. We must stop the confusion about which technology is going to win; it achieves nothing positive and risks damage to the entire industry.

Confusion unsettles investors, who move to other markets and starve us of the R&D funds needed to deliver mobile broadband. At street level, confusion leads early adopters to hold off making commitments to the new wave of technology while they “wait it out” to ensure they don’t buy a Betamax instead of a VHS.  Where we should focus, urgently, is on the two topics that demand open discussion and debate. First, are we taking the delivery of a winning user experience seriously? Secondly, are we making plans to cope with the data tidal wave that will follow a successful launch?

The first topic concerns delivery to the end user of a seamless application experience that successfully converts the improved data rates to improvements on their device. This can mean anything from getting LAN-like speeds for faster email downloads through to slick, content-rich and location-aware applications. As we launch mobile broadband technologies, we must ensure that new applications and capabilities are robust and stable. More effort must be spent developing and testing applications so that the end user is blown away by their performance.

The second topic, the tidal wave of data, should force us to be realistic about the strain placed on core networks by an exponential increase in data traffic. We have seen 10x increases in traffic since smartphones began to boom. Mobile device makers, network equipment manufacturers and application developers must accept that there will be capacity shortages in the short term and, in response, must design, build and test applications rigorously. We need applications with realistic data throughput requirements and the ability to catch data greedy applications before they reach the network.

In Anite, we see the demands placed on test equipment by mobile broadband technologies at first hand. More than testing the technical integrity of the protocol stack and its conformance to the core specifications, we produce new tools that test applications and simulate the effects of anticipated capacity bottlenecks. Responding to the increased demand for mobile applications, we’re developing test coverage that measures applications at the end-user level. Unfortunately, not everyone is thinking that far ahead. Applications that should be “Wow”, in theory, may end up producing little more than a murmur of disappointment in the real world.

So, for the sake of our long-term prospects, let’s stop this nonsense about how one technology trounces another. Important people, the end users, simply do not care.  WiMAX, LTE and HSPA+ will all be widely deployed. As an industry, our energy needs to be focused on delivering services and applications that exceed the customer expectations.  Rather than fighting, we should be learning from each other’s experiences.  If we do that, our customers will reward us with growing demand. If we all get sustained growth, then don’t we all win..?

Source: http://www.telecoms.com/11695/wimax-vs-lte-vs-hspa-who-cares-who-wins/

HSPA, UMTS, GSM, LTE and Other Acronyms Demystified

22 Aug

Unpaired spectrum and the promise of affordable capacity

7 Aug
Unpaired spectrum could offer a cost-effective solution for mobile operators that want to meet the growing demand for data. However, several drawbacks of time division duplexing need to be overcome to unlock the capacity potential of this spectrum.
Mobile operators are having to meet growing demand for data, and yet their ARPUs are flat. They therefore need cost-effective solutions to deliver more data. One way of adding capacity to a network is to provide it with more spectrum. Conveniently, a lot of unpaired spectrum is becoming available in higher frequency bands, which is typically less expensive to acquire than paired, sub-1GHz bands.

Unpaired spectrum can be used by transmission technologies using time division duplexing (TDD), which allows both the uplink and downlink to be carried by the same frequency band. In addition, the use of the TDD mode of LTE allows for an asymmetric uplink/downlink ratio (see Figure 1), ideally suited to cater for the increasingly asymmetric data consumption that might be expected in the future. Operators are therefore looking carefully at whether the use of TDD in unpaired spectrum may be a solution to the capacity crunch that they are facing.

Figure 1: Difference in spectrum use between FDD and TDD [Source: Analysys Mason, 2012]


There are a number of drawbacks to TDD that must be overcome. In earlier generations of cellular technology, such as 3G, a major issue was that the integration of TDD with FDD did not emerge in a timely way in most world regions. One reason for this was that the TDD and FDD modes of 3G use different air interface schemes. However, in LTE both the TDD and FDD modes are based on a similar scheme – orthogonal frequency division multiple access (OFDMA) – resulting in greater commonality between the two modes, which should facilitate TDD–FDD integration.

One drawback of TDD is that it requires a guard period between the uplink and downlink transmissions during which the signal can travel between transmitter and receiver before the direction of the communication is reversed (see Figure 1 above). However, this gap is proportional to the distance between the transmitter and the receiver, so the inefficiency is minimised if TDD is used to provide short-range services, as in capacity cells.

Another issue with TDD is that operators using adjacent blocks of spectrum need to synchronise their networks so that both are sending uplink and downlink transmissions at the same time. If there is a misalignment, the base station trying to receive uplink traffic will receive interference from the base station transmitting downlink traffic. The same problem can occur between handsets. Currently, synchronisation requires operators to put in place a separate network element that aligns the two networks’ transmissions. However, the TDD mode of LTE-Advanced may simplify the process through the use of ‘over the air’ synchronisation, thereby making synchronisation more affordable to implement. However, the adoption of this into the standard is yet to be confirmed.

The success of unpaired spectrum depends on the availability of devices that can use it. Traditionally, devices are designed to operate in up to four bands, although more-recent developments suggest that support for at least six bands may be required for LTE. For reasons of backwards compatibility and international roaming, three of these are likely to be taken up by the low-frequency coverage bands of GSM, HSPA and LTE networks used in different world regions. In addition, operators will employ a number of FDD capacity bands, such as the 1800MHz, 2.1GHz and 2.6GHz bands. Therefore the fourth slot (and possibly the fifth and sixth) will be contested by a number of options. There are two solutions to this problem: either manufacturers will find a way to cost-effectively combine more bands in a single device, or they may customise devices for individual operators by allowing them to choose the bands to be supported. The second option would result in significantly higher prices because of the reduced economies of scale possible for customised devices.

This may leave operators with the option of focusing their TDD services on USB modem users, as the bands supported by a USB modem can be customised at little additional cost. However, this would not allow operators to fully exploit newly acquired unpaired spectrum because the volume of USB modem traffic is insufficient to fill the additional capacity – at least so far. Manufacturers will also require a number of years to adapt to demand for devices with more bands or customised bands. Therefore, the capacity potential of unpaired spectrum has yet to be unlocked.

Source: Analysys Mason – http://afridigital.blogspot.nl/2012/08/unpaired-spectrum-and-promise-of.html#!/2012/08/unpaired-spectrum-and-promise-of.html

HSPA+ vs LTE: Which one is better?

3 Aug


We have all marveled at the revolution in mobile communications technology. The 1980′s saw the introduction of the “brick” style wireless mobile phone accessible to a privileged few. Since then, we have seen a lot of shifting trends in designs and capabilities, but an exponential increase in availability and popularity. We now live in a world boasting over 6 billion mobile phone users, with most high-end devices mimicking the capabilities of a computer, featuring dual-core or even quad-core processing capability.

I still recall a time when the primary purpose of a mobile phone was voice communication. Now, with smartphones bursting onto the scene in ever growing numbers, the mobile landscape is changing rapidly. With devices now featuring messaging, social networking connectivity, email and browsing capabilities, and the ability to stream or download high-quality music and videos, making and receiving calls has almost become a secondary feature.

Of course, none of this would be possible without an equally impressive evolution in mobile networking technology. From first generation communication networks to the current 4G craze, these advances have made it incredibly easy for any user to always be connected. Today we will compare the latest networking technologies, namely HSPA+ and LTE, and take a look at what the future holds.

History 

First generation mobile networks were basic analog systems designed purely for voice calls. Mobile devices and call rates were very expensive and therefore not available to everybody. The early nineties saw the introduction of the first digital cellular networks. 2G brought with it improved sound quality and a higher capacity, allowing for data services, albeit at very low speeds up to 14.4 kbps. Further advances in this technology introduced GPRS and EDGE features with quicker data speeds between 40kpbs to 100kbps.

This was followed by the 3G revolution. Apart from wide-area voice telephony, it introduced high-speed internet access, far improved audio and video streaming capabilities, support for video calls and conferences, and internet TV. With effective speeds ranging from 128kbps to 384kbps, the advent of 3G completely changed the way people use their mobile phones.

The effective entry of the tablet and increasing dependency on handheld mobile devices led to demand for even faster speeds and connectivity options, leading to a new standard, HSPA+, followed by 4G LTE.

What is HSPA+ and LTE?


HSPA+

HSPA+ or Evolved High Speed Packet Access, is a souped-up version of HSUPA and HSDPA 3G standards with speeds comparable to the newer LTE networks. Theoretical speeds are said to feature download speeds up to 168Mbps and uplink of 22Mbps. These are of course theoretical speeds, with the actual speed available to users being much lower. While most HSPA+ networks around the world boast a theoretical 21Mbps(download) speed, T-Mobile(USA) and Deutsche Telekom(Germany) feature 42Mbps networks. A hotly debated issue is the 4G tag offered by cellular network companies to advertise their HSPA+ networks(T-mobile and AT&T), while most accept that it should be considered, at most, a 3.75G network.

LTE

On the other hand, LTE, or Long Term Evolution, is considered a “true” 4G network. Theoretical speeds boast downlink speeds of 300Mbps and uploads of 75Mbps. LTE, which is an IP-based system, is a complete redesign and simplication of 3G network architecture resulting in a marked reduction in transfer latency. Because of this, LTE is not compatible with 2G and 3G networks and thus, functions on an entirely different wireless spectrum. Unfortunately, this means that erecting an LTE network requires it to be built from the ground up. This is one of the main factors behind the delayed launch of  complete 4G LTE networks.

Bottom Line

HSPA+ is the tip of the mountain with 3G technology, and LTE is simply the foundation for a new mountain. LTE, also k nown as 4G, is the most advanced telecommunications technology currently available, and is one that defines a clear path toward future developments, making it the most attractive choice for carriers these days.

Speed Comparison

The biggest question consumers have is whether the additional cost of buying an LTE-enabled device and the higher data charges are worth it, compared to the “slower” but relatively cheaper 3G and HSPA+ networks. Let’s take a look.

Under consideration are speed comparisons based on the recently conducted wireless speed tests by PCWorld, of the major network carriers in the US (AT&T, T-Mobile, Verizon, and Sprint). For our purposes, we are going to compare the LTE-based AT&T and Verizon 4G networks, against the 42 Mbps HSPA+ based T-Mobile “4G” network. While Sprint and T-Mobile both aim towards launching their LTE networks soon, as of now, they are based on Wi-Max technology and HSPA+ respectively.


PCWorld, along with their testing partners Novarum, conducted the tests using Ookla’s speed test app in 13 cities across the US including San Francisco, Los Angeles, San Jose, Seattle, Las Vegas, Denver, Dallas, Chicago, New Orleans, New York, Washington D.C., and Boston.

There are a few key points to note from the chart above:

  • T-Mobile’s HSPA+42 network performs admirably against, what is supposed to be, far superior LTE networks. The high speeds offered by this network should be more than enough for most users.
  • LTE is fast! While HSPA+ is definitely good enough, the LTE networks(in their current state) are 20-30% faster. A big plus for all the speed demons out there.
  • Unrelated to the topic, but is anyone as surprised as I am at how poorly Sprint’s Wi-Max network performed?

Granted these results for HSPA+ aren’t standard the world over, with most networks featuring 21Mbps download capabilities. But all these network carriers are planning to upgrade to 42Mbps and even 84 Mbps networks, so HSPA+ still has a lot of potential, and is certainly “good enough” for now.

Coverage

As you can see from the map above, 4G LTE is certainly the network of the future. With the much faster speeds, higher efficiency, and increased reliability, it is the next logical step in network technology development. There are some key points to note about the map though, which shows that LTE coverage isn’t as “colorful” as it seems:

  • While a lot of countries are marked “red” indicating countries with commercial LTE services, it is slightly misleading. For example, while India as a whole is marked, only one carrier(Airtel) offers 4G LTE services in only one city(Kolkata) thus far. Of course, plans are in the works to rollout the network eventually, it will take quite a lot of time before complete coverage is achieved.
  • The above point is true for most countries, with none boasting a full coverage LTE network. Full coverage in some regions will be achieved at the earliest by late-2013 to early-2014, with most others much later.

On the other hand, HSPA+ is more along the lines of a software enhancement that elevates 3G data network performance. Of course, the process isn’t as simple as it sounds, but it is definitely easier than building a completely new LTE supported network. As such, any carrier that has an established 3G network, have upgraded to an HSPA+ network. With over 100 network carriers worldwide featuring HSPA+ networks with most boasting over 80% coverage. To keep up with current LTE speeds, carrier networks are also upgrading the their “slower” 21Mbps networks to 42Mbps or even 84Mbps (theoretical) download speeds.

Cost 

As mentioned earlier, the biggest issue with taking advantage of the faster speeds of a 4G LTE network is coverage. Availability is still quite limited but that will of course, get better. What surprised me is the lack of a difference in cost between a carrier’s HSPA+ and LTE networks.

  • AT&T and Verizon have standard data rates of $50 for 5GB regardless of whether you have access to 3G, HSPA+, or 4G LTE networks.
  •  T-Mobile, which currently features a 42Mbps HSPA+ networks, also features the same data rates.
  • In India, while available only in Kolkata so far, 4G LTE costs Rs 1399(~$28) for 9GB, with HSPA+ being Rs 1250(~$25) for 10GB.

Of course, I’ve only used the information from two places I’m most familiar with, so there might be other networks worldwide where there is a more evident price difference (or not), so if there are, do let us know in the comments section.

Device availability


HSPA+ and LTE variations of the Samsung Galaxy Nexus

Device availability is another area where I consider LTE to be at a disadvantage. Here’s why:

  • Most smartphones and tablets (3G versions) released in the last 2 years or so can access the faster speeds offered by HSPA+ networks.
  • On the other hand, accessing a LTE network requires a significant hardware change, i.e. the need for an LTE radio.
  • Options for LTE capable devices are comparatively limited and generally range towards the higher end of the price spectrum.
  • There has been an incompatibility issue with latest Nvidia quad-core Tegra 3 processor and LTE radios, as seen with the HTC One X where the international version features the quad-core processor, and the US releases with LTE radios “falling back” on Qualcomm dual-core Snapdragon S4 processors. Whether this issue will be prevalent in other quad-core processors such as the Samsung Exynos 4412, is yet to be seen.
  • LTE radios are also infamous for being a huge drain on battery life.

The Future

HSPA+


Evolution of HSPA

HSPA+, with its theoretical 168Mbps downlink speeds, still wasn’t the pinnacle of HSPA technology. Back in 2010 began talk of LTHE or Long Term HSPA Evolution. LTHE brought with a lot of advantages including:

  • Backward compatibility with existing WCDMA and HSPA networks. This provided the possibility of an easy transition to LTHE as opposed to a network upgrade to LTE.
  • Theoretical download speeds up to a whopping 672 Mbps.
  • Carriers and hardware companies claimed that LTHE could have been ready for deployment by 2013.

Unfortunately, almost every network around the world has decided to move onto LTE as their network for the future. HSPA+ networks will likely be upgraded to the 42Mbps or even 84Mbps download capability, but now, it seems like that is as far as this evolutionary technology will be pushed.

LTE

While HSPA+ was the peak of 3G technology, the current variation of 4G LTE is only the first step in this next stage, opening up numerous possibilities for much further advancement in this field. It is somewhat strange that advances in LTE technology are already being spoken about when the “original” standard networks aren’t even close to being fully established. Yet, that is the rapid speed in which the tech world progresses. Let’s take a look at some of these developments:

  •  TD-LTE:  TD-LTE or Time-Division LTE was developed by China Mobile over the last few years. Unlike LTE networks which carries two separate signals for data traveling in either direction, TD-LTE features a single channel and allocated upload and download bandwidth depending on your usage. This accounts for higher data speeds. TD-LTE is also compatible 4G WiMax and it will easier to upgrade from WiMax to TD-LTE than to LTE.
  • LTE Advanced: LTE Advanced is a further evolution of current LTE networks which brings with it theoretical peaks of 1GBps download speeds, increased spectrum efficiency(upto 3 times more bandwidth), and reduced latency. Like the upgrade from HSPA to HSPA+, a move from LTE to LTE-Advanced is also a software deployment upgrade.
  • TD-LTE will also see a shift to TD-LTE advanced in the future.

Conclusion

Advantages of LTE over HSPA+

  • The most obvious advantage is the higher data speeds
  • Much better spectrum efficiency
  • Far lower latency
  • LTE has a simpler architecture compared to an HSPA+ network

Advantages of HSPA+ over LTE

  • HSPA+ is an already established network, whereas complete LTE coverage still has a while to go
  • HSPA to HSPA+ evolution required much less investment in infrastructure and was less costly to upgrade as opposed to LTE which needs a completely new network built from the ground up.
  • LTE requires specific LTE radio featured devices, whereas HSPA+ is available to any user with a 3G enabled phone.

As you can see, LTE is definitely the way of the future, and the potential with this technology is incredible. But I still think there are a lot of factors that lead me to conclude that HSPA+ networks are certainly more than enough for now.

What are your thoughts? Is HSPA+ good enough for now? Is LTE not here fast enough? Let us know in the comments section below. We’d love to know what you think!

Source: http://www.androidauthority.com/hspa-vs-lte-which-one-is-better-78120/ – by Ankit Banerjee on May 06, 2012

LTE Operator Strategies: Key Drivers, Deployment Strategies, CAPEX, OPEX, Price Plans, ARPUs and Service Revenues 2012 – 2016

2 Aug

Skyrocketing mobile broadband demand is driving an ever increasing number of commercial LTE network deployments. This surge has seen the number of LTE subscriptions already surpass 7 Million subscriptions worldwide, and over 300+ commercial LTE user device launches.  As Mobile Network MNOs (MNOs) remain committed to deliver mobile broadband services over their LTE networks, a number of critical questions remain unanswered: 

How much revenue can an MNO generate with an LTE deployment ? 
What is the typical ARPU for an LTE subscription worldwide or in particular regional market and how will it fluctuate in the next 5 years ?
What is the relative Total Cost of Ownership (TCO) of an LTE network in comparison to competing technologies such as HSPA + and WiMAX ?
What is the market outlook for VoLTE (Voice over LTE) and wholesale LTE networks, and when would the first VoLTE deployments take place ?
How much CAPEX and OPEX would an MNO require to deploy at LTE network, and what strategies can be adopted to minimize both CAPEX and OPEX ?

Covering over 325 global MNOs in 120 countries, this report answers the aforementioned questions by quantifying LTE service revenues, subscriptions, ARPUs, CAPEX and OPEX. In addition, the report reviews key trends in LTE deployment strategies such as VoLTE and SMS over LTE, the wholesale deployment model, Self-Organizing Networks (SONs) and the emergence of the data off-load (small cells, HetNets,  Wi-Fi offload) equipment market. 
 
The report further provides a global review of LTE price plans and key MNO strategies for LTE pricing and marketing. The report is supplement by an excel based interactive forecasting suite that can be used to forecast LTE service revenue, ARPUs, and subscriptions for particular regional markets, countries or MNOs from 2011 till 2016. 
 
Key Findings:
 
ARPUs and Operator Service Revenues

Driven by early adoption among the enterprise users, LTE ARPUs will peak in 2012 reaching 88 USD per month, and drop down by a YoY decline of 16 % over the next five years as the consumer market segment gains a higher market share. 
Having already surpassed 7 Million subscriptions, LTE subscriptions are set to grow at a CAGR of 150 % over the next five year period.
Growing at a CAGR of 80 % global LTE service revenues will reach 291 Billion, representing a lucrative market for worldwide MNOs. LTE service revenues presently account for 15 Billion USD. 
While the Asia Pacific region will attain the highest number of subscriptions by 2016, the North America and Western Europe region will retain market leadership in terms of service revenues according for almost 60 % of all LTE service revenues worldwide.  

Deployment Strategies
 
Mind Commerce estimates the first VoLTE deployments will take place in Q4’2012, with US and Korean MNOs the first to enter the market.
While early market prospects in the US appear to be deteriorated, the wholesale LTE model will increasingly gain momentum over the next 5 years, and we expect to see the first commercial launch by UK Broadband in 1H 2012. 
 
CAPEX and OPEX Strategies

By 2016, the Total Cost of Ownership (TCO) for LTE will remain 44 % lower than HSPA+ and 50 % than WiMAX.
If used to full potential, SON technology has the potential to reduce worldwide LTE deployment CAPEX $ 55 Billion, and $ 15 Billion in OPEX by 2016 

Pricing Strategies
 
Most MNOs are adopting tiered based price plans based on volume and speed in order to maximize revenue while managing capacity. Unlimited plans may gain momentum as MNOs learn to divert revenues with OTT (Over-The-Top) players with technologies such as VoLTE, and as they attain cheaper network TCO by deploying small cells and WiFi offload equipment.
 
Report Benefits

A Global review of LTE price plans and pricing and marketing strategies for MNOs worldwide
LTE service revenues, ARPUs and subscriptions by region, country and operator for 2011, and forecasts till 2016
LTE deployment strategies and key trends including VoLTE, Wholesale deployment model and FDD/TD-LTE integration
CAPEX and OPEX requirements and strategies for LTE MNOs, including a review of CAPEX commitments by major MNOs worldwide
Overview of the LTE market including key market drivers, commercial network deployments, subscriptions and device launches (as of March 2012) and frequency spectrum selection and fragmentation  

Target Audience:
 
Mobile Network Operators (MNOs): Will make well-informed decisions about deployment strategies, CAPEX/OPEX reduction and price plans. Furthermore, “Greenfield” operators will understand how to capitalize on LTE technology by assessing the strategies of well established CSPs and MNOs.
 
Mobile Network Infrastructure Vendors and Handset Manufacturer: Will assess particular issues faced by MNOs investing in LTE and align their product offerings accordingly. 
 
Application Developers: Will evaluate opportunities to invest in developing applications and services that run on LTE networks by understanding the market dynamics of LTE.
 
Investors: Will better understand the LTE technology and its market potential, its value chain and potential. This report will help investors evaluate the investment prospects in the promising LTE ecosystem.

Source: http://www.healthcarestoreonline.com/wiki/lte-operator-strategies-key-drivers-deployment-strategies-capex-opex-price-plans-arpus-and-service-revenues-2012-2016 –        By adminPublished: August 1, 2012 at 6:30

GSA forecasts 115 DC-HSPA+ networks will be in commercial service by end 2012

28 Jul

Two updated reports published this month by GSA, the Global mobile Suppliers Association, confirm how HSPA systems are delivering mobile broadband to new markets and achieving higher levels of performance and efficiencies enabled by HSPA+ and DC-HSPA+ deployments.

499 operators have firmly committed to deploy HSPA systems, which is 12% higher than one year ago, in 189 countries and territories.

Every WCDMA operator has commercially launched HSPA on their networks. 472 HSPA networks, 15% higher than a year ago, are commercially launched in 183 countries.

HSPA+ is rapidly spreading. 279 operators have committed to HSPA+ network deployments, representing an increase of 45% in the past year. Mobile operators entering the market today typically launch with HSPA+ capability incorporated in their networks. 234 HSPA+ networks are commercially launched i.e. 98 more than a year ago.

Almost 50% of HSPA operators have commercially launched HSPA+ on their networks.

The rapid evolution of network capabilities to using 42 Mbps DC-HSPA+ is a strong trend, as operators invest in improvements to network performance, capacity and efficiencies to maintain and enhance user experience. 90 DC-HSPA+ networks have been commercially launched which is a 130% increase over the past year. Around one in five HSPA operators have commercially introduced the DC-HSPA+ technology. 89 DC-HSPA+ systems support a theoretical peak downlink speed of 42 Mbps, while 84 Mbps DC-HSPA+ is also market reality on one network.

GSA forecasts there will be at least 115 DC-HSPA+ networks in commercial service by end 2012.

42 UMTS900 networks have been commercially launched in 900 MHz spectrum, enabling HSPA or HSPA+ operators to significantly extend mobile broadband coverage, typically as a result of re-farming a portion of existing spectrum which had previously been used for GSM voice service.

HSPA and HSPA+ deployments status – global:

  • 472 HSPA operators are      commercially launched in 183 countries (GSA survey: July 18, 2012)
  • 100% of WCDMA operators      worldwide have also deployed HSPA
  • 367 commercial HSPA      networks (over 77%), support 7.2 Mbps (peak DL) or higher
  • 232 HSUPA networks      commercially launched in 108 countries, i.e. 49% of HSPA operators have      launched HSUPA
  • 167 HSUPA networks support      up to 5.8 Mbps peak UL and another 12 networks support 11.5 Mbps peak
  • HSPA Evolution (HSPA+) is      mainstream. 279 HSPA+ network commitments globally
  • 234 HSPA+ networks are in      commercial service in 112 countries
  • Almost 50% of HSPA      operators have commercially launched HSPA+
  • Evolution to DC-HSPA+      technology is a strong trend; 90 DC-HSPA+ networks are commercially      launched
  • Market outlook: GSA      forecasts at least 115 DC-HSPA+ networks will be in commercial service by      end 2012
  • 42 commercial UMTS900      operators are launched i.e. HSPA, HSPA+ or DC-HSPA+ deployed in the 900      MHz band

Source: http://www.gsacom.com/news/gsa_356.php – July 27, 2012: