Archive | 3:52 pm

Here’s What 5G Means for Your Laptop and Tablet

28 Sep

5G is finally here and all the major wireless carriers are rolling out their new networks and churning out devices for the nascent technology. Naturally, everyone is advertising the blazing-fast speeds and telling us that 5G is going to change everything.

shutterstock_5g_COV2
It’s an exciting time for laptop owners as this might be the year that we see true all-day battery life. And with a multitude of folding devices launching, there’s a good chance we’ll see smartphones truly functioning as viable productivity machines, with a few wires and accessories, of course. And with Wi-Fi 6 and more powerful chips, you can expect laptops to be faster and more powerful than before.

But what exactly is 5G and how is it going to impact you in 2019 and beyond? To answer that, let’s take a look at where 5G stands today and what it should look like in the years to come.

5G: The Basics

On the most basic level, 5G stands for the fifth-generation wireless cellular standard. This will operate alongside 4G LTE for the foreseeable future and 3G for at least the next three years as carriers begin shutting down that aging networking standard. These standards are created by an organization known as the 3rd Generation Partnership Project (3GPP) which is comprised of seven telecommunications standard development organizations.

shutterstock_5g_COV

The history of these standards dates back to the late 1970s, 1G got its start in Japan in 1979 and saw its first United States. launch in 1983, this was voice-only and only became known as 1G following the release of its successor. 2G arrived in Finland in 1991, arriving two years later in the U.S., and was the first digital standard, it introduced text messaging, picture messaging, MMS, and encryption. 3G became commercially available in Japan in 2001 and in the U.S. the following year, its primary benefit was the tremendous boost in data speeds over 2G. 4G got its start in Norway in 2009 and in the U.S. in 2010, again the speed gains were the most notable benefit with seamless streaming of music and video possible for the first time.

That brings us to the present with 5G, arriving again almost a decade after its predecessor and bringing with it another considerable leap in data transfer speeds, a dramatic reduction in latency and the capacity to connect vastly more devices. While South Korea was first to a commercial launch of 5G, it was just a little bit ahead of the launch in the U.S., making this the first time the U.S. has been part of the initial launch year for a new wireless standard.

5G: The Spectrums

There are three distinct frequencies on which 5G can operate (low, mid and high band spectrums), each of them offer distinct advantages and disadvantages.

Low-band

This is the same area in which LTE operates in the U.S., below 1GHz frequencies. The advantage of low-band is that it can travel long distances and penetrate buildings. But with peak speeds at around 100 Mbps, low-band can’t offer anywhere near the speeds that mid- or high-band solutions promise. This is roughly what we are seeing from strong 4G LTE areas today, although it’s worth noting 4G isn’t limited to those speeds. So while low-band will still be relevant going forward to ensure coverage in rural areas, it won’t deliver the kind of speeds and latency advantages that most would expect from a “5G network.”

Mid-Band

In many ways, mid-band seems like the ideal solution for nationwide 5G as it still offers a reasonable range while also delivering much of the speed that 5G promises. This has been a popular option for 5G propagation throughout the rest of the world, but in the U.S., available mid-band spectrum is extremely limited thanks to existing commitments. Sprint is the only carrier in the U.S. presently with sufficient mid-band spectrum to offer 5G services.

High-Band

The majority of the early 5G rollout in the U.S. is happening in the high-band via millimeter-wave (mmWave), which covers radio band frequencies of 30 GHz to 300 GHz. This is where we are presently seeing the amazing speed tests with download speeds topping 1Gbps under the right conditions. The theoretical limits on high-band 5G is closer to 10Gbps. As you might have guessed, the big downside here is the range. Real-world testing of the current implementations of mmWave have shown connections drop after just a few hundred feet and any obstructions — like going inside — will cut that even further.

5G: The Wireless Carriers

All four of the major wireless carriers in the U.S. have rolled out their 5G networks this year, but the extent of those rollouts as well as the technology they use differs. AT&T is out to an early lead, but by year’s end only Sprint will be lagging behind if everyone manages to hit their stated goals.

samsung-phone-5g

AT&T

Currently active in 21 cities, AT&T has been fastest out of the gate with its 5G network and it projects that it will deploy in 30 cities by the end of 2019, however access is still limited to select business customers. This is not to be confused with AT&T’s 5G Evolution (5GE) that started showed up on some AT&T devices at the end of 2018. That’s really just a revision to its 4G LTE network that falls well short of 5G standards. AT&T is exclusively using mmWave currently and will be upgrading those nodes in the next year to boost their performance while also rolling out some low-band 5G to extend coverage.

Sprint

Currently active in nine cities, Sprint is also going to be the slowest rollout this year as it isn’t projecting any additional 5G cities by the end of the year. On the plus side for Sprint, as we mentioned earlier it is the only U.S. carrier with mid-band spectrum (2.5GHz) and thus has considerably more extensive 5G coverage in those cities than the other carriers can boast in their 5G cities. Sprint is also using Massive MIMO (Multiple Input Multiple Output) transceivers and beamforming to further boost its 5G coverage, putting 64 transmitters and 64 receivers on a single array which can then track devices to direct a signal more precisely at them.

T-Mobile

Currently active in six cities, T-Mobile is also targeting 30 total cities for its 5G network by the end of 2019. While they are using mmWave at the moment, T-Mobile will be augmenting this with its low-band 600MHz 5G sometime in the future.

Verizon

Currently active in 13 cities and some NFL stadiums, Verizon is looking to match T-Mobile and AT&T by the end of the year with 30 total cities on its 5G network. Verizon is also exclusively using mmWave at the moment, but like AT&T and T-Mobile they plan to ultimately add 5G on its low-bands to extend the networks reach.

5G: The Hardware

Limited is probably the best way to describe the available 5G hardware today, not surprising given the current state of the networks, but there is plenty on the horizon.

Laptops

Qualcomm showed off its Project Limitless 5G laptop with Lenovo using the Snapdragon 8cx processor and Snapdragon X55 5G modem in May with a planned launch sometime in 2020, but nothing’s available for consumers yet. This is the first Snapdragon chipset designed entirely with PCs in mind and should deliver always-connected and always-on laptops with true all-day battery life and once the 5G networks get up to speed it opens up some interesting new capabilities.

qualcomm

Storage is one problem that is largely solved by 5G, given the speed and low-latency, access to files whether local or in the cloud should be virtually indistinguishable. Similarly collaboration on even large video files for example, becomes possible in real-time. Live-translation during video calls, one of Qualcomm’s own examples, could be achieved using the on-board AI of the Snapdragon 8cx along with 5G. And on a more fun note, online gaming or game streaming services should be flawless on a 5G connection.

In December Qualcomm will be holding its Snapdragon Tech Summit, where they announced the Snapdragon 8cx last year, so we can expect to hear a lot more about what’s coming for 5G laptops.

Smartphones

The Samsung Galaxy S10 5G is the lone 5G smartphone that is available across all four networks. Additional 5G smartphones currently available include the LG V50 ThinQ, the OnePlus 7 Pro 5G, the Samsung Galaxy Note 10 Plus 5G and the Moto Z4/Z3/Z2 Force with a 5G Moto Mod, with availability depending on carrier.

Hotspots

AT&T, Sprint, and Verizon each have a single 5G hotspot available currently. On AT&T it’s the Netgear Nighthawk 5G Mobile Hotspot, which is only presently available to business customers. Sprint has the unique HTC 5G Hub, which features an ethernet port, a 5-inch touchscreen, and Android 9. Finally, Verizon offers the Inseego MiFi M1000, which is a more traditional hotspot again with a 2.4-inch color touchscreen.

5G: The Future

While our first taste of 5G is going to be on smartphones, this isn’t going to be where we see the biggest impact for 5G. While we’ll appreciate faster downloads and more seamless high-definition streaming video, the “killer app” for 5G isn’t here yet.

Driverless vehicles are another potential landing spot for 5G, with cars and traffic signals all able to communicate with virtually no delay it would make for vastly safer travel. And returning to a simpler advancement, 5G should make high-speed home internet available to rural areas that can’t access it at present. While 5G isn’t going to change everything in the next year, it’s easy to get excited about what could be possible with it in the years to come.

Source: https://www.laptopmag.com/articles/what-is-5g
28 09 19

Have You Addressed the Skills Gap in Your AI-Powered Digital Transformation?

28 Sep
Have You Addressed the Skills Gap in Your AI-Powered Digital Transformation?

Digital Transformation has been a buzzword for years, with AI and advanced analytics playing a key role in enabling Communications Service Providers (CSPs) to improve their customer experience, get new services and products to the market much faster, and reduce costs through automation. Skills Transformation, on the other hand, is another crucial aspect in this transformation yet is rarely discussed in-depth. One of the biggest challenges isn’t the implementation of technology but the skills gap – upskilling and training employees, especially given the shortage of AI specialists.

What specific skills are needed, in which areas of your company, and what steps can be taken now to address the gap? I’ll discuss this further in this article.

CSPs at present mode

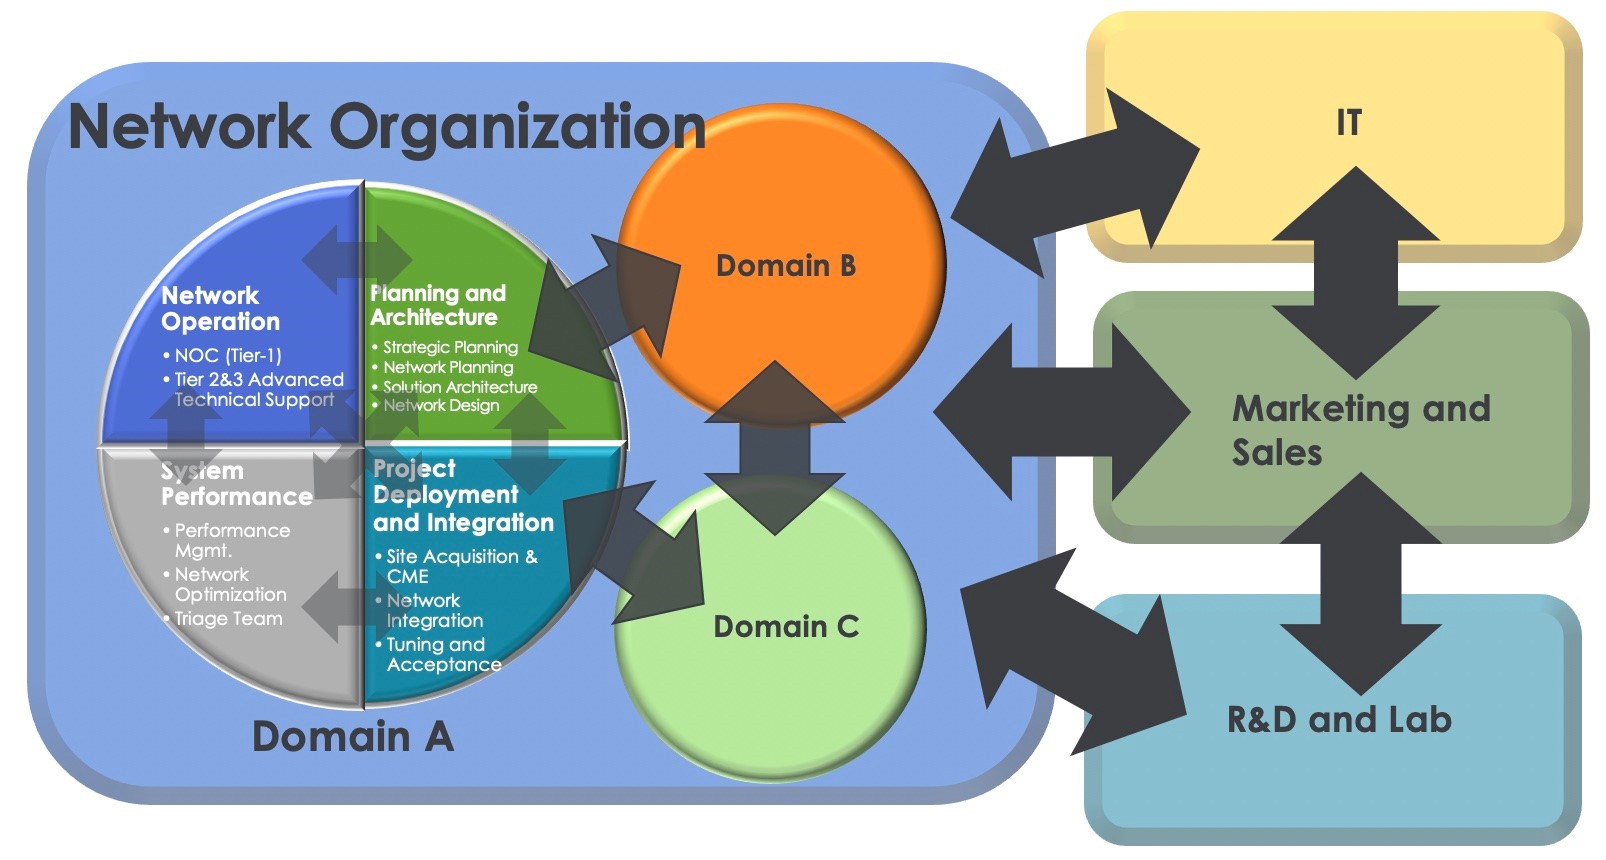
The Network organization within a CSP is often the center of discussion. It’s where technology evolved from 1G to the current LTE/4G, and in the future to 5G. And this group tends to be one of the biggest, from a headcount and budget perspective. The illustration below shows daily collaborations internally within a particular network domain, cross-functionally/between domains, and externally with other organizations.

Figure 1: Network organization and its interactions internally and externally. Image credit: Guavus.

Some examples we’ve seen in terms of real practices and collaborations within CSP organizations include the following:

The RAN Capacity Plan, led by Planning, is jointly reviewed with the Optimization Team. This is important to not over-estimate expansion which could result in unnecessary CAPEX spending. Understanding temporary and/or seasonal traffic patterns from subscribers in particular areas is very important. Some of the capacity overload problems are still manageable by performing some physical changes on the sites, enabling RAN’s load balance features, and/or parameters tuning. Those actions are less expensive than buying more hardware/software and licenses for capacity expansion.

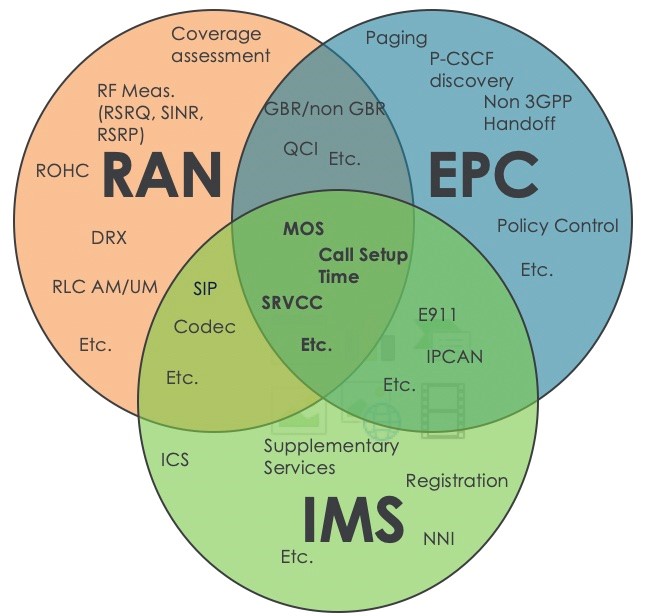
One root cause of the VoLTE muting call issue is non-optimal end-to-end timers setting across different network elements. A collaborative discussion between cross-domain experts (RAN, EPC, and IMS) to improve these timers is very important, taking into account several different scenarios with a steps approach and the least impact on subscribers.

The Customer Service Center often receives thousands of customer complaints daily. The customer service officer needs to quickly identify the problems (network or handset related) to take further actions with customers. The typical workflow starts with a generic query to find out if there was a service disruption within a location described by the customer during the period of time reported. If nothing is found here, the customer service officer then follows up on this issue by raising a ticket to the Network Operation Center (NOC) Team to perform further investigation which is typically around alarms and minor troubleshooting efforts. If it’s still not solved, the ticket is transferred to the next level, either the Tier-2/3 Advanced Technical Support Team or the Triage Team from Performance if it’s more on KPIs-related investigation.

These processes can easily take hours and days to sometimes weeks to resolve. For more complicated issues, another level of collaboration between the local and national team, and/or even cross-domain experts, is sometimes required. And this requires much longer time to resolve.

These practices can easily consume up to 90 percent of employees’ time, with huge numbers of people involved; long cycle times; costly hardware and software upgrades, licenses, third-party fees; etc. They’re not able to spend enough time to learn new technologies or innovate ways to improve cycle times since these workflows require intensive data readout analysis and trials (i.e., what-if scenarios).

Many of the CSPs we work with are introducing AI-based analytics and automation to make a drastic shift from this present mode of operation. However, they’re not just looking to us to “fish for them but to help teach them to fish.” Their teams are looking for AI-based analytics applications for customer care, network operations, marketing, and security they can put into place very quickly – but they also want to learn how to build their own custom AI-based applications to quickly address the unique needs of each of their business groups in the future.

What’s needed to make this shift? Below are some of the key steps they’re taking to make an AI-based skills and digital transformation in order to better operate and deliver an improved customer experience.

5 key steps to making an AI-powered skills and digital transformation

1. Data Lake Infrastructure with Self-Service Capabilities for Business Owners

Some major CSPs already have this type of data lake up and running, while others are still building it. This data lake has to be properly designed and provides self-service capability that enables business owners (as well as Network groups) to explore and mine the data for insights, any time they require, to make better business decisions. Simple SQL knowledge is optionally required, this can easily be obtained through their internal knowledge base or by searching the Internet. With this capability in place, there are no longer ad hoc and heavy-query requests from business owners to the IT/Data Team to build custom reports, which sometimes can take days.

2. End-2-end (E2E) Domains Knowledge as a Future-Looking Analytics Enabler

CSPs need to view and solve issues based on a cross-services or applications approach rather than a siloed or per domain approach. As an example, solving VoLTE quality problems, Mean Opinion Score (MOS), as seen on Fig. 2 below, is one of the most important metrics. It requires all domain experts to sit together and acknowledge MOS lies in the intersection of all domains. In mature CSPs, an E2E Team is often created that consists of senior-level experts with more than 15 years of cross-domain knowledge and experience. The E2E Team drives the overall Network organization into a better operating, cross-functional/domain collaboration compared to the siloed domain-based approach, hence the cycle time is greatly improved.

Figure 2: Network domains and the intersections. Image credit: Guavus.

3. Data Science Knowledge for Domain Experts

With the high demand for data science expertise and limited supply of data science experts in the market, acquiring the best resources is very challenging. Compensation for this job role is very high as well. It also introduces another level complexity within the CSP’s organization – that is, a new data scientist and AI organization. This does not mean that building a new Data Science Team is not important, but what really matters is justifying the right size of the organization and executing the right use cases based on real pain points found in the field. Thus, enabling Domain Experts to acquire new data science knowledge should be considered a strategic imperative. This can be done by having:

Domain experts develop the skills by participating in learning courses and/or obtaining a formal data science degree. Domain Experts can then practice what they’ve learned from the courses by building the models through various machine learning tools, writing code, performing what-if analysis, etc. However, this can require a big time investment before the CSP sees the value in a production environment.

Pick up an analytics solution that provides domain experts with an ecosystem that enables them to simply turn a new idea (or a new use case) into a production environment. The solution provides the domain experts with various prebuilt analytic algorithms and machine learning models to play with, import-your-own models capability, and simply drop-and-drag UI to build workflows without requiring them to write lines of code. This solution also requires architectural flexibility to interwork with any existing data lake infrastructure owned by CSP. This option is often a lot quicker compared to the previous one.​

4. Application-centric Analytics powered by ML/AI as a Revolutionary Way to Plan and Optimize Network Resources

Once the E2E Team has acquired additional data science knowledge, the next step is to build application-centric analytics powered by AI.

As an example is VoLTE Customer Experience Management (CEM) analytics with automated Root Cause Analysis (RCA) and a Recommendation Engine to close the loop. With this solution, an issue can be identified faster with proposed recommended actions to be taken. This implementation requires real-time analytics capability and truly brings efficiency within the CSP’s overall operation workflows – where the issue can be resolved within a few minutes versus days or weeks in the current mode of operation. This type of analytics will evolve towards 5G and IIoT with more stringent requirements.

Another example is 5G Capacity Management. Network Slicing and Dynamic Spectrum Sharing will drastically change the way Domain Experts plan for the 5G resources. Domain Experts can now analyze different capacity scenarios with what-if analysis based on different capacity requirements (e.g., application requirements, layer management and carrier bandwidth, special events, mobility patterns and threshold settings, time of day/week/month, coverage shape, the site’s physical configuration, etc.). This new method of operation will significantly decrease the amount of time consumed by a Domain Expert on analyzing historical data which previously took weeks or months into a matter of hours or days (or even seconds, if real-time action is required (such as in special events capacity management).

5.Innovation at Heart

Last but not least, being an innovative and data-driven company will determine ongoing success for CSPs. The ability to translate market needs, automate repetitive tasks, continuously improve internal processes, and minimize cycle time will sustain their competitiveness and secure their growth in future. As an example, having Exploratory Data Analysis (EDA) process in place with the right use cases derived from real business problems can help them make the right investments. Most strong companies encourage their employees to innovate every day and reward their efforts. An innovative mindset should be owned by everyone, not just a few individuals in the company.

More than just technical skills

Digital Transformation is a must for every CSP whether they like it or not. They can’t provide the improved customer experience and new services to compete and gain new business with the many challenges ahead unless they can make this transformation. Vendors, on the other hand, can take their part by proactively researching CSPs’ main pain points and building solutions with AI capabilities that provide real value on Day 1 in production. With cost pressure on the shoulders of CSP executives, rather than doing everything themselves, creating partnerships with vendors who understand the complexity of the CSP business, organization, services and customer experience and know-how to not just apply AI and analytics technology but train CSP employees on how to use them is key to success. Addressing the skills as well as the digital gap enables CSP executives to truly be transformers of their business.

Source: https://www.thefastmode.com/expert-opinion/15575-have-you-addressed-the-skills-gap-in-your-ai-powered-digital-transformation
28 09 19

A 5G C-RAN Optical Fronthaul Architecture for Hotspot Areas Using OFDM-Based Analog IFoF Waveforms

28 Sep
The proposed fronthaul architecture may be a promising solution for the future Fifth Generation (5G) Fiber-Wireless (FiWi) networks to provide broadband access services to overcrowded small-scale hotspots.

Abstract

Analog fronthauling is currently promoted as a bandwidth and energy-efficient solution that can meet the requirements of the Fifth Generation (5G) vision for low latency, high data rates and energy efficiency. In this paper, we propose an analog optical fronthaul 5G architecture, fully aligned with the emerging Centralized-Radio Access Network (C-RAN) concept. The proposed architecture exploits the wavelength division multiplexing (WDM) technique and multicarrier intermediate-frequency-over-fiber (IFoF) signal generation per wavelength in order to satisfy the demanding needs of hotspot areas. Particularly, the fronthaul link employs photonic integrated circuit (PIC)-based WDM optical transmitters (Txs) at the baseband unit (BBU), while novel reconfigurable optical add-drop multiplexers (ROADMs) cascaded in an optical bus are used at the remote radio head (RRH) site, to facilitate reconfigurable wavelength switching functionalities up to 4 wavelengths. An aggregate capacity of 96 Gb/s has been reported by exploiting two WDM links carrying multi-IF band orthogonal frequency division multiplexing (OFDM) signals at a baud rate of 0.5 Gbd with sub-carrier (SC) modulation of 64-QAM. All signals exhibited error vector magnitude (EVM) values within the acceptable 3rd Generation Partnership Project (3GPP) limits of 8%. The longest reach to place the BBU away from the hotspot was also investigated, revealing acceptable EVM performance for fiber lengths up to 4.8 km.
Keywords:

5G networks; analog intermediate-frequency-over-fiber; optical fronthaul; multicarrier communication; OFDM; PIC-based transmitter; ROADM

1. Introduction

Broadband mobile connectivity is rapidly evolving towards the fifth generation (5G) era, defining a new set of requirements beyond the capabilities of the legacy long-term evolution (LTE) based fourth generation (4G) networks [1]. The widespread use of emerging applications, such as 4K high definition streaming, augmented/virtual reality applications (AR/VR), immersive video conference, etc., has created the need for ubiquitous high bandwidth connectivity and enhanced mobile broadband (eMBB) services [2,3]. Stimulated by this completely new landscape, expert alliances, such as the International Telecommunication Union (ITU) [4] and Next Generation Mobile Networks (NGMN) [5], have defined certain key performance indicators (KPIs) for 5G broadband access networks. According to these indicators, user data rates of 1 Gb/s and peak rates of 20 Gb/s with latency less than 10 ms are targeted, resulting in high area connection densities up to 106 devices per km2 and capacities up to 10 Mb/s/m2 [4,5].
Towards satisfying these ambitious set of requirements, 5G technology focuses on the deployment of New Radio (NR) systems and exploitation of millimeter-wave (mm-wave) radio in the access networks [6] through Multiple-Input Multiple-Output (MIMO) systems [7], targeting to migrate from the congested 6 GHz radio to larger contiguous spectral bands. The above came into realization also with 3GPP Release 15 for 5G NR that specifies frequencies up to 52.6 GHz and channel bandwidths up to 400 MHz [8], while the future 3rd Generation Partnership Project (3GPP) Release 16 will include higher spectrum at the 57 GHz–71 GHz band. Within this framework, the first 5G trials and deployment roadmaps are expected to be installed initially on overcrowded privately-owned and small geographical scale hotspot areas [9,10], e.g., sport stadiums, airports, etc., where the presence of many users can lead to economically viable network installations at reduced costs [11].
The employment of higher spectral bands necessitates the densification of the access points (APs), due to their inherently high propagation and attenuation losses [12]. However, when applying the traditional macro-cell distributed radio access network (RAN) architectures at ultra-dense mm-wave environments, it comes at the expense of increased acquisition, deployment and operational costs, which in itself is detrimental to the mobile network operators’ (MNOs) business model [13]. Moreover, when using backhauling in ultra-dense mm-wave networks, a tremendous burden is placed to the management layer that must now coordinate and cancel interference from an order of magnitude more sources that are densely placed in the complex and ever-changing mm-wave environment [14]. For these reasons, operators are currently shifting to centralized solutions, such as the centralized-RAN (C-RAN) [15,16], where all demanding processing operations that were part of the Base Station (BS), are now moved into the baseband unit (BBU), placed in a centralized location. In parallel, the operationally simple remote radio heads (RRHs) are dispersed across the APs and connected to the BBU through what is termed as fronthaul. Thus, it becomes apparent that centralization reduces greatly the capital and operational expenditures of deploying dense networks [17], while at the same time the formation of the single-point origin of the downlink signals enables improved radio coordination and increased energy efficiency through optimized capacity sharing and statistical multiplexing.
Despite the cost-reduction and energy efficiency improvement, centralization results in a tremendous increment in time-sensitive traffic in the fronthaul part of the network [18,19], which, in the dense mm-wave AP era will be required to include the transportation of several ultra-broadband >400 MHz NR mm-wave channels at a small latency and energy envelope. Currently, the centralized BBU is connected with the RRHs via digital radio-over-fiber (D-RoF) links using standardized protocols such as the Common Public Radio Interface (CPRI) [20], which may not be capable of covering the traffic demands of the next-generation mobile networks [14]. This is because CPRI imposes a very high penalty in terms of bandwidth overhead since it requires a high number of samples in order to digitally transport and reconstruct the wireless signal at the edges of the fronthaul. To overcome these issues, enhanced CPRI (eCPRI) has been proposed as the next generation interface for D-RoF fronhauling [21], providing flexibility in the splitting of the functions performed in the BBU and RRH. However, the different levels of functional split introduce a trade-off between the bit rate and centralization of the RAN. While D-RoF technology tries to overcome the bandwidth explosion with a network layer approach, analog-radio-over-fiber (A-RoF) fronthaul solutions focusing on the physical-layer have been recently proposed in order to further improve the optical spectrum efficiency by the transmission of native analog waveforms over the fiber [22,23]. Towards bringing A-RoF fronthaul networks into realization, research efforts have been currently directed in the development of some key-enabling technologies comprising the use of: intermediate frequency (IF) channel aggregation [24,25], orthogonal frequency division multiplexing (OFDM) waveforms [26], wavelength division multiplexing (WDM) [27] and photonic integrated circuits (PICs) [28].
Drawing from these latest achievements, we recently proposed an analog optical fronthaul 5G architecture that relies on PIC-based transceivers (TxRxs) and reconfigurable add/drop optical multiplexers (ROADMs) to synthesize a privately owned hotspot fiber–wireless (FiWi) network for stadiums [29], evaluated in terms of network throughput and latency [30]. Preliminary physical-layer simulation results of only the downlink fronthaul link have been also reported in [31].
In this paper, we extend our previous work [31] by providing for the first time the complete physical-layer evaluation analysis of the proposed 5G fronthaul architecture for both downlink and uplink OFDM-based analog IF-over-fiber (A-IFoF) links. The proposed links employ photonic indium phosphide (InP) externally modulated lasers (EMLs) at the transmitter (Tx) site and optical Mach-Zehnder Interferometer (MZI)-based ROADMs at the hotspot area. Our analysis relies on an experimentally-verified simulation models of the optical TxRxs as well as the signal degradation induced by the fiber. The WDM functionalities are leveraged by a novel design of a ROADM configuration supporting up to four WDM channels with 100 GHz channel spacing. The proposed ROADM device is integrated on the ultra-low loss Si3N4/SiO2 TriPleX platform, with propagation loss of 0.1 dB/cm [32]. The successful transmission of 4-IF band OFDM 64-QAM signals with bit rates up to 12 Gb/s per wavelength was confirmed by carrying out error vector magnitude (EVM) measurements. The successful operation revealed that the proposed architecture can be a cost-effective, energy-efficient and low-latency 5G candidate network solution for high-density hotspots.
The paper is organized as follows: Section 2 presents the key technologies of the A-RoF fronthaul links. Section 3 describes the concept of the proposed fronthaul. Section 4 presents the experimentally-matched simulation models, while Section 5 presents the PHY-layer setup and results. Conclusions are addressed in Section 6.

2. Key Technologies for Analog-Radio-over-Fiber (A-RoF) Fronthaul Links

In order to prepare mobile fronthaul networks for the emerging 5G era, worldwide research efforts have been directed towards upgrading the underlying key technologies, which currently appear to follow some widely adopted deployment directions:
(1) High capacity optical links between the BBU and the RRH for efficient mobile fronthauling. Current CPRI-based D-RoF links may not meet the high bandwidth and low cost requirements that will be imposed by 5G mobile traffic, due to the digitization of samples from the radio domain [20]. For instance, for a potential 5G implementation with carrier aggregated 200 MHz signals, 64 × 64 MIMO and three sector antennas, a fronthaul link of 2.4 Tb/s would be required by using CPRI [33], necessitating the prohibiting number of 100 × 24 Gb/s optical TxRxs. Moreover, digital interfaces of CPRI introduce excess delay and jitter, rendering them incompatible with the high speed services that require strict synchronization. To solve these issues, A-RoF technique has been proposed as a promising candidate for the realization of a bandwidth- and cost-efficient fronthaul links [22]. A-RoF allows the transportation of native radio waveforms over the fiber via analog optics, enabling a remarkable reduction of the required bandwidth [22,23]. The most common A-RoF transport methods are considered to be the Radio Frequency-over-Fiber (RFoF) and the IFoF techniques [34]. In RFoF, the BBU directly transmits the mm-wave signal via the fiber to the RRH, without the need for frequency up-conversion at the RRH side. Although this technique allows for simple RRH designs, it is not preferred for the transport of mm-wave signals over fiber, since it requires the equipment of the RRH with expensive high-speed TxRxs and at the same time the mm-wave signals are significantly affected by the fiber chromatic dispersion [35].
In this context, IFoF has emerged as a more appealing A-RoF technique that allows transportation of multiple aggregated IF bands, modulated by cost-effective, low-bandwidth linear EMLs [24]. In IFoF, the signals are transmitted via a fiber in different IFs and the up-conversion at the mm-wave band takes place just before the wireless transmission. In this way the effect of the fiber chromatic dispersion is significantly reduced and the use of cost effective low-speed optical TxRxs is enabled. So far, the IFoF-based fronthaul architectures supporting multiple frequency bands, evaluated only for the fiber part of the network have achieved CPRI equivalent rates up to 1 Tb/s per wavelength [25,36,37]. Moreover, converged FiWi IFoF demonstrations have been shown to reach capacities up to 45 Gb/s per wavelength when using simple quadrature amplitude modulation (QAM) formats and sub-carrier (SC) multiplexing of multiple IF bands [38,39,40,41]. Considering FiWi links using OFDM formats, the maximum capacity has been reported to be equal to 24.08 Gb/s, using a single RF band with a bandwidth of 6.02 GHz [42]. On the other hand, FiWi IFoF links that satisfy at the same time both requirements for increased number of IF bands and the use of OFDM numerology, have been demonstrated with lower aggregate bit rates [43,44]. Particularly, the maximum reported capacity for this type of demonstrations reached up to 4.56 Gb/s using multiple IF bands of 152 MHz bandwidth [43].
(2) OFDM-based waveforms, relying on narrow-band SCs, formed the cornerstone and shaping technology for the success of 4G LTE networks [45]. The employment of OFDM allows for simple wireless channel estimation and efficient hardware utilization. Therefore, the OFDM waveform numerology in both uplink and downlink communication has already been approved by 3GPP as part of the NR physical layer design [26,46]. This has stimulated also the demonstration of various OFDM-based 5G optical fronthaul links, with the majority of the high capacity demonstrations based on costly, bulky Mach Zehnder modulators (MZMs) [42,43,47]. However, recently a few demonstrations also reported on high bit rates by using more cost effective directly modulated laser (DML)-based Txs [44].
(3) WDM techniques to extend the capacity of the fronthaul network by the transmission of multiple wavelength channels over a typical single mode fiber (SMF). The mature WDM technology, recognized already as a cost-efficient access solution for passive optical networks (PONs) [48,49]. With the same rationale, it can be also exploited in flexible and wavelength-reconfigurable fronthaul architectures [29] in order to meet the high-capacity 100 Gb/s KPI target for hotspot use cases [5] while at the same time, allowing for a smooth migration from the multi-SMF space division multiplexing (SDM) networks to simplified and more cost-effective single-SMF deployments [49]. Similarly, driven by the recent progress in the development of multi-core fiber (MCF) SDM hardware [50], SDM fronthaul architectures based on MCF single-fiber deployments have been also proposed as a long term solution for the hotspot use case [51]. These solutions can provide an additional degree of freedom in multiplexing, however, several technical and economic aspects should be taken into account for a viable upgrade of a fronthaul from the mature WDM systems [52] to the possible future hybrid WDM/SDM solutions [53].
(4) PIC technologies that have been already proven beneficial for optical communication networks [54], can offer significant energy and cost savings also to the mobile fronthaul architectures. This can be achieved by employing cost-/energy-efficient and ultra-compact PIC-based optical TxRxs, to allow large-scale and dense 5G fronthaul topologies [55]. Moreover, PIC technology can provide a low-loss integrated platform for the ROADMs, allowing wavelength multiplexing and switching operations at the access networks with fast light-path reconfiguration times and low power consumption. However, both integrated devices have been yet investigated only for metro-rings and PONs [56].
Towards bringing 5G into realization in the near future, intense research and industrial efforts have indeed achieved remarkable progress on each of these distinct technologies. However, it still remains unclear what will be the optimum network platform that will manage to incorporate all innovation aspects within the pressing timeline of 5G [57,58], while satisfying the ambitious 5G KPI requirements, for high data rates and low latencies. In this context, we present an analog 5G fronthaul architecture that manage to incorporate all these key-enabling technologies in order to provide broadband access services to overcrowded private hotspots.

3. 5G Fronthaul Architecture for Private Hotspots

Figure 1a shows the conceptual representation of the proposed optical fronthaul architecture of a sports-stadium. The proposed system consists of a BBU-Box at a centralized location, e.g., at the backhaul or the metro-ring network of a converged FiWi architecture, being optically interconnected with multiple RRHs placed around the stadium (hotspot) in a bus topology and equipped with a ROADM and mm-wave antennas. The traffic exchange between the BBU and the RRHs of an optical bus relies on dedicated wavelength-specific WDM TxRxs comprising a number of integrated photonic EMLs and photo-receivers equal to the number of the WDM channels. It should be noted that the proposed fronthaul architecture supports frequency aggregation per wavelength, allowing in this way to load several user channels on different IF bands all carried by the same wavelength. Each RRH employs an integrated photonic ROADM for dropping any of the available WDM channels to the specific RRH or forwarding it to the next RRH of the bus, achieving in this way allocation of the available optical downlink capacity to different regions of the stadium. The ROADM is also responsible for adding any of the available WDM channels to the respective RRH, when uplink traffic is transmitted from the wireless-users to the BBU. Moreover, each RRH comprises a number of mm-wave antennas, each of them responsible for the optical-to-electrical (o/e) conversion of a specific WDM channel dropped by the ROADM and its up-conversion to the mm-wave band for wireless transmission to the end-users. Similarly, during the uplink traffic, each RRH’s antenna is responsible for the reception, IF-conversion and electrical-to-optical (e/o) conversion of the mm-wave signal to a wavelength-specific optical signal.
Figure 1. (a) Fronthaul architecture for serving a typical stadium area, where a number of buses is deployed. Each bus consists of a number of remote radio heads (RRHs), each one interconnected with a reconfigurable optical add-drop multiplexer (ROADM) through single mode fiber (SMF) wavelength division multiplexing (WDM) is also exploited. (b) Configuration of the baseband unit’s (BBU’s) and the RRHs’ WDM wavelength-specific TxRxs employed for the downlink communication between the BBU and the RRHs, and the uplink communication of the RRHs with the BBU.
Figure 1b depicts the configuration of the BBU’s and RRHs’ WDM TxRxs enabling the simultaneous transmission of the n downlink and n uplink signals through two independent and different direction SMF links. Considering that this fronthaul architecture targets small-scale private networks, wavelength-specific WDM TxRxs are preferred to be employed over wavelength-tunable solutions, since for this scale, they allow for simpler and more cost efficient implementations. The same WDM channel grid can be used for both uplink and downlink traffic, since the uplink and the downlink are independent WDM links.
Focusing on the downlink connection, the BBU’s Tx contains an array of n wavelength-specific EMLs, each one modulating an individual multi-IF signal on a different WDM wavelength and an n:1 multiplexer (MUX) that multiplexes the n WDM channels and provides the single optical interface to the downlink SMF. At the hotspot site, n RRHs are employed, where the receiver (Rx) of each RRH comprises the drop part of the ROADM that is capable to either drop any of the available n WDM channels at one of its n output drop ports (if the data are intended for the specific RRH) or to forward it into the bus of the other RRHs (if the data are intended for another RRH). The RRH’s WDM Rx is also equipped by an array of n photodiodes (PDs) and transimpedance amplifiers (TIAs) that are connected with the n drop ports of the ROADMs in order to perform the o/e conversion and the amplification of any of the n WDM channels. It should be noted that the BBU’s Tx can employ any of the available n WDM wavelengths to communicate with the any of the RRHs, however, the same wavelength cannot be used simultaneously for the communication of the BBU with ≥ 2 RRHs. During a low traffic period, that one or more downlink WDM channels may not be used by the BBU, the respective dedicated EMLs are switched off.
The uplink communication is based on an identical and independent link that connects the RRHs’ bus with the BBU. Particularly, the Tx from each of the n RRHs comprises an array of n wavelength-specific EMLs, each of them capable to modulate a different WDM wavelength with an individual multi-IF converted signal carrying the data of the wireless end-users. Each RRH can employ simultaneously any of the n WDM channels to transmit data to the BBU, however the same WDM channel cannot be used simultaneously by ≥ 2 RRH’s Txs, since collision will occur. In case that one or more WDM channels are not employed by a RRH, then the respective EMLs of this RRH are switched off. The outputs of the EMLs are connected with the n add input ports of the ROADM, so as the ≤ n modulated WDM channels to be inserted on the uplink optical bus and forwarded by the intermediate RRHs’ ROADMs to the BBU premises. It should be noted that the uplink data signals coming from a RRH are never dropped to the Rx of another RRH of the uplink bus. At the BBU’s Rx, the WDM channels coming from one or more RRHs are de-multiplexed by a 1:n WDM demultiplexer (DEMUX) and inserted into the array of n PDs and TIAs.
Towards designing the overall architecture, it is critical to identify what is the optimum set of resources in terms of fiber-distances, optical losses, number of wavelengths and IF bands, modulation formats, etc. The main target of this work is to meet the 5G KPIs, while simultaneously complying with the physical (PHY) layer performance metrics of the underlying hardware and maintaining a low cost and power consumption envelope, as presented in the next sections.

4. Simulation Modeling

In this section, we present our methodology for matching the simulation models of the main building blocks with the response of the respective fabricated and designed actual devices. The matching methodology was implemented as follows: As described in Section 4.1, the first step was to create a reliable simulation model for the optical modulator that will follow closely the static experimental behavior of a high-power linear InP EML [55]. As a second step, we carried out physical-layer simulations for an analog optical IFoF fronthaul link using a fully-matched EML model at the PIC-based optical Txs’ side and a SMF as the transmission media [59]. As it is described in Section 4.2, the goal of this simulation was to fully match the signal degradation induced by the EML’s chirping effect and the chromatic dispersion of the fiber link, with the respective results of the experimental link presented in [41]. In Section 4.3, the ROADM simulation model was matched with the estimated response of a MZI-based ROADM design, currently being fabricated on the Si3N4/SiO2 TriPleX platform [32].

4.1. Externally Modulated Laser (EML) Static Simulation Model

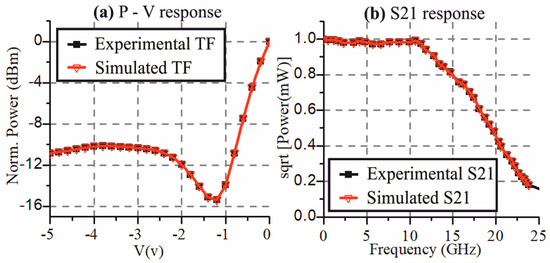
Firstly, we created the static simulation model for the employed optical modulator. Its static response was matched with the respective experimental characterization results (S21 response, power–voltage curves) of a fabricated EML. The fabricated EML was monolithically integrated on an InP platform [55], designed to operate in the 1550 nm window. It consisted of the laser section co-integrated on the same chip with the electro-absorption modulator (EAM). Figure 2a shows the power versus input voltage curves for the simulation model and the experimentally-measured EML device. As it can be seen, the measured and the simulated responses were identical, having a linear regime between −1 V and −0.2 V, corresponding to an extinction ratio (ER) of 12 dB. Moreover, Figure 2b shows the perfectly matched measured and simulated electro-optic S21 curves of the EML, exhibiting in both cases a flat-top response of 11 GHz.
Figure 2. Matching of the experimentally-measured and simulated (a) power versus volts transfer functions of the externally modulated laser (EML), and (b) S21 response of the EML.

4.2. Externally Modulated Laser (EML) Chirp Simulation Model

Since in the previous sub-section the adequate matching of the EML’s static behavior was achieved, the next step was to provide a fully-matched simulation model of the EML including also an approximation of its chirping effect. To this end, an analog optical IFoF link was simulated using: (a) a fiber simulation model that its response was matched with a commercial available SMF [59] including all the known parameters such as losses, dispersion, dispersion slope, etc., and (b) the EML model with the known static response and the under investigation chirp response. To goal of this study was to approximate the EML’s chirping effect by matching the performance of this simulated link with the performance of an experimentally-evaluated optical IFoF link that employed the actual fabricated EML and SMF transmission, as presented in [41]. It should be noted that, in the experimentally-measured link the EML static response, the fiber characteristics, the power of the signal at various stages of the link as well as the noise figure of the electronics were all known values and the only unknown factor was the chirping effect of the EML.
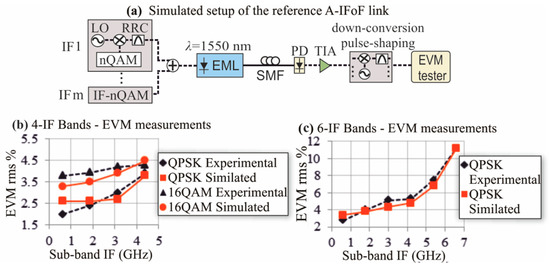
Figure 3a shows the simulated setup employed for the analog IFoF fronthaul link. A number of m (m = 4,6) QPSK or 16-QAM data signals were electrically generated and each of them up-converted to a different IF frequency by the multiplication with the respective local oscillator (LO). Pulse shaping was implemented on the data signals by using root raised cosine (RRC) shaping filters with roll-off factor equal to 0.2. The IF-up converted signals were SC multiplexed and inserted into the EML in order to modulate a continuous wave (CW) at 1550 nm. The IFoF signal exiting the EML was fed into a SMF for transmission to the Rx. In order to investigate the role of the SMF link, a fiber length of 7 km was employed as in the experimental link presented in [41].
Figure 3. (a) Simulated setup of the reference analog IFoF optical link using the matched EML and SMF models. Matching of the experimental and simulated EVM performance of the SC modulated A-RoF link for: (b) 4-IF bands and (c) 6-IF bands after 7 km fiber transmission.
The Rx comprised a PD with responsivity of 0.7 A/W that converted the optical IFoF signal to the respective electrical SC multiplexed-IF signal and a low-noise TIA with 20 dB gain. After down-conversion and pulse shaping, the resultant baseband signals were sent to the EVM tester for the performance evaluation.
To achieve the performance matching of the simulated and the experimentally-verified IFoF link presented in [41], we considered a dispersion coefficient of 17 ps/(nm·km) at the reference wavelength of 1550 nm and a dispersion slope of 0.08 ps/(nm2·km), as it is the case for a typical SMF [59]. For the same purpose, we approximated the EML’s frequency chirp effect by including in our EML model, a voltage-dependent chirp factor that varies from 3.5 to −4, similar to experimentally observed values presented in [60].
Figure 3b shows the simulated and experimentally-measured EVM values for a four-band SC multiplexed transmission of QPSK and 16 QAM data signals at a symbol rate equal to 1 Gbd. The IF frequencies of the four SCs were equal to 0.625 GHz, 1.875 GHz, 3.125 GHz, and 4.375 GHz, respectively, while the fiber length was equal to 7 km. As it is observed, the performance of the simulated link followed closely the performance of the experimentally evaluated fronthaul link. For both modulation orders the EVM slightly increased for the higher IF bands, while the use of 16-QAM slightly deteriorated the performance of the link when comparing with the QPSK results. Finally, Figure 3c presents the EVM measurements for a six-band SC signal modulated with QPSK format at 1 Gbd symbol rate. As it can be seen, the simulated and experimental performance were quite similar, both showing an increasing EVM for the last two IF frequencies after 7 km fiber transmission. This performance deterioration at the higher IF frequencies is attributed to the combination of two effects: (a) the chromatic dispersion of the fiber and (b) the chirp effect of the EML. All the above simulated results which were directly compared with the experimental results reported in [41], confirming the successful modeling of the fiber transmission and the EML for various channel setting (modulation order, number of IF sub-bands, fiber length).

4.3. Reconfigurable Optical Add-Drop Multiplexer (ROADM) Simulation Model

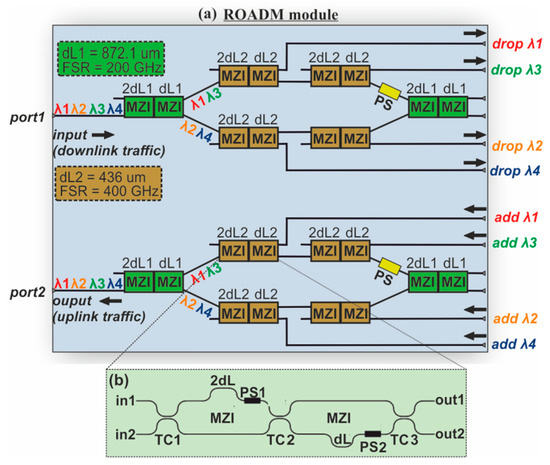
In this sub-section, we describe the ROADM simulation model used for the evaluation of the proposed hotspot IFoF fronthaul link. This simulation model was matched with the estimated response of a PIC-based MZI-based ROADM design that is currently being fabricated on the Si3N4/SiO2 TriPleX platform [32]. The employed ROADM was designed by Lionix International B.V. [61] to add/drop four wavelengths in the C-band with a channel spacing of 100 GHz. The choice of the ROADM’s operational band and the maximum number of supported WDM channels was made in such a way that the proposed fronthaul infrastructure will meet the KPI targeted bandwidth for hotspots [5]. The ROADM design can be certainly extended to support a higher number of WDM channels by following an expanded MZI-based layout similar to the work reported in [62]. Figure 4a depicts the ROADM circuit-layer design which consisted of the identical drop-enabling and the add-enabling circuitries, both based on a cascaded configuration of MZI-channel interleavers [62]. For the sake of simplicity the description of the drop operation will follow, whereas the add operation is considered to be regulated by the same principle, being performed on the reverse direction.
Figure 4. (a) ROADM physical layer design and implementation comprising the identical drop-enabling and the add-enabling circuitries, both based on cascaded Mach-Zehnder Interferometers (MZIs), (b) building block of the cascaded MZIs.
Initially, the four wavelengths (λ1, λ2, λ3, λ4), were fed into the input port of the first (green) cascade of MZIs. This block of MZIs had a free spectral range (FSR) of 200 GHz in order to split the 200 GHz spaced λ1λ3 and λ2λ4 wavelengths to its output port 1 and port 2, respectively. Each WDM output signal was inserted to the brown cascade of MZIs which had an FSR equal to 400 GHz. Focusing on the upper arm of the ROADM, the first brown block of MZIs dropped λ1, while the second cascade of MZIs dropped λ3. Similarly, λ4 and λ2 were exiting the output port 1 of the first and second cascade of MZIs at the lower arm.
Figure 4b illustrates the building block of the cascaded MZIs comprising two MZIs connected to each other via tunable couplers (TCs). In this way, it was possible to control the coupling coefficients of the device, and thus, obtain the desired transfer functions at its outputs. The first MZI had an arm difference of 2·dL while the arm difference of the second one was equal to dL. Due to the dispersion, it is crucial that the 2·dL and dL are not in the same path, but on the opposite parts of the waveguides. Phase Shifters (PS1 and PS2) were placed in each MZI in order to adjust the maximum and minimum power spectral positions of the filter of the MZIs for dropping or passing the proper wavelength.
The required arm difference for the block of MZIs with FSR = 200 GHz (green) was equal to dL1 = 872.1 um while the respective difference for the block of MZIs with FSR = 400 GHz (brown) was equal to 436 um. The coupling coefficients of TC1, TC2 and TC3 can be set anywhere between 0 and 1. When the add-drop operation was required, the TC1, TC2, and TC3 coefficients were adjusted to be equal to 0.9248, 0.28 and 0.50, respectively, in order to achieve the proper filtering of the four wavelengths, while all coupling coefficients were set to 0 when through operation of the ROADM was needed. In the second case, the filter structure was circumvented and the all the incoming light passed at the output of the ROADM. To calculate the total optical losses of the ROADM, we considered that in TriPleX technology the interface loss between the fiber and the ROADM chip was between 0.5 dB and 1.25 dB, the TCs loss was 0 dB and the maximum propagation loss, corresponding to the longest length of 58.2 mm, was equal to 0.6 dB. Considering the above maximum loss values, the maximum losses of the ROADM were expected to be equal to 3.1 dB.
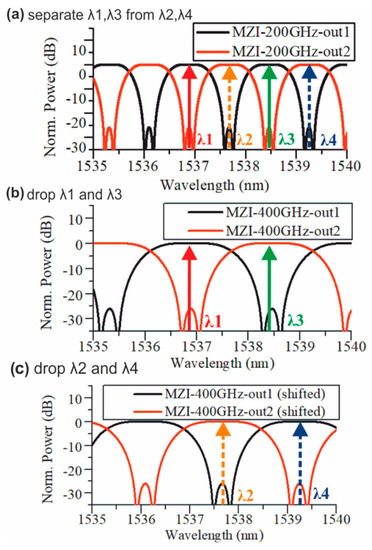
Figure 5a illustrates the spectral response (SR) for the output ports 1 and 2 of the green block of MZIs having an FSR equal to 200 GHz. As it can be observed only wavelengths λ1 ( = 1536.9 nm) and λ3 ( = 1538.46 nm) were exiting the output port 1 of the green MZIs’ block while wavelengths λ2 ( = 1537.67 nm) and λ4 ( = 1539.25 nm) were dropped at the output port 2, all placed at the flat-top area of the filters. These wavelengths were then fed into the brown cascades of MZIs. Figure 5b shows the respective SR of the brown cascade of MZIs that were incorporated in the upper arm of the ROADM and has and has a FSR equal to 400 GHz. Particularly, in this case, λ1 and λ3 were inserted in the input port 2 of the first brown MZIs’ block and by properly adjusting the phase of the PSs, λ1 is dropped at the output port 1, while λ3 was dropped at the output port 2. Similarly, Figure 5c shows the SR of the brown cascaded MZIs (FSR = 400 GHz) employed in the lower arm of the ROADM. As it is shown, in this case the SR of the brown cascade was adjusted to add or drop λ2 at output port 2 and λ4 at output port 1. It should be noted, that in all cases flat-top filter shape was obtained by properly adjusting the coupling coefficients of the TCs. The present design has assumed TE waveguide, while as a next step, a polarization-insensitive Si3N4/SiO2 waveguide and MZI filters should be employed [63,64].
Figure 5. Simulated spectral response of the cascaded MZIs’ filters. (a) The filter with FSR = 200 GHz, passing λ1 and λ3 at its output port 1 and λ2 and λ4 at its output port 2. (b) The filter of the cascaded MZIs with FSR = 400 GHz properly phase adjusted to drop λ1 and λ3, and (c) the filter of the cascaded MZIs with FSR = 400 GHz properly phase adjusted to drop λ2 and λ4.

5. Hotspot Optical Fronthaul Using OFDM Multi-IF Band Transmission

In this section, we present physical layer simulations carried out by means of VPIphotonics software suite [65], in order to verify the successful operation of the proposed 5G optical fronthaul architecture for OFDM multi-IF signals with SC modulation of 64-QAM format. Two simulated setups were employed: a) the setup of a reference single wavelength link without the use of the ROADM and b) the setup of the proposed WDM hotspot link with four ROADMs in a bus topology. By comparing the performance of these two fronthaul links, useful conclusions about the additional degradation induced by the WDM transmission and the ROADM filtering effect were derived. It is worth noting that the verified simulation models described in Section 4 were incorporated in both setups, so as to provide reliable simulation results.

5.1. Simulated Setup

5.1.1. Single-wavelength link without ROADM

For the performance evaluation of the reference single wavelength optical IFoF fronthaul link when OFDM signals are employed, we simulated the setup shown in Figure 6a. This setup relies on the simulation models described in the first 2 sub-sections of Section 4. With the chirping properties having been accurately modelled for two different modulation formats, i.e., single-carrier QPSK and 16QAM, that were the only available experimental-verified results [41], this simulation model can be reliably employed towards evaluating the performance of the underlying fronthaul even for different modulation formats like OFDM, which are considered to be more suitable for the next-generation mobile traffic [46]. A different network performance is obviously expected when a different modulation format is used, suggesting that our simulation model can be reliably employed for validating the performance of different network configurations and different modulation formats before engaging into the real experimental deployment of the system.
Figure 6. Simulated setup of the IFoF optical fronthaul using OFDM, for (a) the reference link employed for the transmission of a single λ and (b) the hotspot link comprising the optical WDM Tx at the BBU and the ROADM network at the RRHs’ side.
A number of four OFDM signals were electrically generated by the respective OFDM encoder that was responsible for the distribution of the input bit sequence into 256 data streams by means of the Inverse Fast Fourier Transform (IFFT) method and the encoding of each SC with 64-QAM modulation format. The real and imaginary I and Q electrical constituents at the output of each OFDM encoder were then pulse shaped by RRC filters with a roll-off factor equal to 0.2 and up-converted to the respective IF frequency by the multiplication with the cosine and sine waves of the respective LO. These signals are then summed to give the transmission signal of each IF band [66]. The up-converted OFDM signals at the different IF frequencies were SC multiplexed and fed into the EAM section of the EML in order to modulate a CW in the window of 1536.9–1539.25 nm provided by the laser section of the EML.
Table 1 summarizes the format parameters of the multi- IF band OFDM signal for the employed SC modulation format of 64-QAM. Four IF bands at 4.4 GHz, 5 GHz, 5.6 GHz, and 6.2 GHz were used with each individual band occupying a bandwidth of 0.5 GHz and consisting of 256 SCs. Each of the SCs has a baud rate of 1.953 Mbd, giving a total data rate of 3 Gb/s per IF band. The OFDM waveforms were separated by a guard band of 100 MHz, while the aggregate data rate of the four channels loaded on the EML optical input was equal to 12 Gb/s, occupying bandwidth of 2.3 GHz.
Table 1. Format parameters of the multi-intermediate-frequency (IF) band signal.
The voltage swing of the multi-IF band signal inserted into the EAM was set at 0.7 Vpp, while the bias voltage of the EAM was equal to -0.4 V in order to ensure operation at the linear regime. The resultant IFoF data signal exiting the EML with a maximum optical power of 2.8 dBm per wavelenght [55], was transmitted through a standard SMF to the PD for o/e IF conversion. After the amplification by the low noise TIA, the output aggregated multi-IF bands were sent to the evaluation unit, where they were down-converted by the multiplication with the respective LOs, pulse-shaped and decoded by the OFDM decoder, emulating the signal processing operations that would normally be performed at the wireless end-users’ site. The OFDM decoder was based on a typical signal processing circuit that performs the OFDM demodulation by means of the nc-points FFT algorithm [66]. After the decoding of the OFDM-64QAM signals, the resultant streams were fed into the oscilloscope (OSC) and the EVM tester for the evaluation of the system. A variable optical attenuator (VOA) was employed to vary the optical power entering the PD for the EVM measurements.

5.1.2. Wavelength Division Multiplexing (WDM) Hotspot Link with Reconfigurable Optical Add-Drop Multiplexers (ROADMs)

The proposed optical fronthaul architecture consisted of two identical optical buses extending around the stadium area, each one consisting of four ROADMs. Without loss of generality, we focused our study on one of the two identical buses in the downlink communication, as depicted in Figure 6b, yet equal optical performance is also expected for the second bus or the uplink communication. The 4-λ WDM Tx of the BBU comprised four EMLs modulating the respective CWs at 1536.9 nm, 1537.67 nm, 1538.46 nm and 1539.25 nm with channel spacing of 100 GHz. Each EML was driven by a different electrical multi-IF band OFDM signal resulting in an aggregate data rate of 12 Gb/s per λ, exactly as the one used in the reference link of Figure 3a and equivalent to the experimental demonstration of the EML-based FiWi link [37]. The modulation format of 64-QAM was adopted for all SCs for each of the four OFDM IF up-converted signals. Table 1 provides a detailed description of the employed format parameters for each WDM channel as it has been already presented for the single-λ reference link. The outputs of the four EMLs were multiplexed by a 4:1 optical MUX into a 4 λ-WDM stream for fiber propagation from the BBU towards the cascade of four ROADMs across half of the stadium periphery, as shown in Figure 1. The data rate of the WDM signal serving half of the stadium was equal to 48 Gb/s (4λ × 12 Gb/s), resulting in a total data rate of 96 Gb/s for the proposed network, where two hotspot links were incorporated.
Four ROADMs were employed for serving half of the stadium traffic, each of them being capable to add/drop the four wavelength carrying data from the BBU to the hotspot area. The ROADMs were placed at equidistant locations around the periphery of the stadium in a bus topology. The distance of the neighboring ROADMs was chosen to be equal to 80 m considering the actual diameter of Toumba’s stadium [67]. In order to investigate the worst case scenario, for the longest reach ROADM of the downlink bus (ROADM4), we have evaluated the performance of a WDM signal that crossed through the first three ROADMs and all its WDM channels were being dropped by the last ROADM. The worst case scenario corresponds to a single-origin capacity problem, which may be obtained during a football match due to the gathering of the crowd in the fan zone of the stadium (possibly being placed on the longest reach RRH). The filtering response of the ROADMs was matched with the transfer functions derived by the physical-layer designs, presented in Section 4.3. After the optical signals were dropped by the last ROADM, they were inserted into the Rx of the fourth RRH comprising an array of four photo-receivers (PD + TIA) for o/e conversion and amplification. For validation purposes of the optical infrastructure, the outputs of the photo-receivers were sent to the evaluation unit in order to be down-converted, pulse shaped, and decoded, emulating the signal processing operations that would normally be performed by the wireless users’ equipment. The decoded signals were then captured by the OSC and EVM tester. VOAs were used for controlling the received optical power entering the PD. Moreover, we evaluated the performance of the WDM signal when each of its wavelength-specific channels was consecutively dropped by the different ROADMs of the downlink optical bus. This second evaluation study corresponds to a multi-origin capacity problem, typically obtained after the end of the football match when the crowd leaves from the stadium and the traffic is uniformly distributed in the hotspot area. Finally, we investigated the performance of the uplink, for the case that the different WDM channels, each one coming from a different RRH, were consecutively added by the different ROADMs into the uplink bus in order to be received by the BBU.

5.2. Error Vector Magnitude (EVM) Performance of the Simulated Fronthaul Link

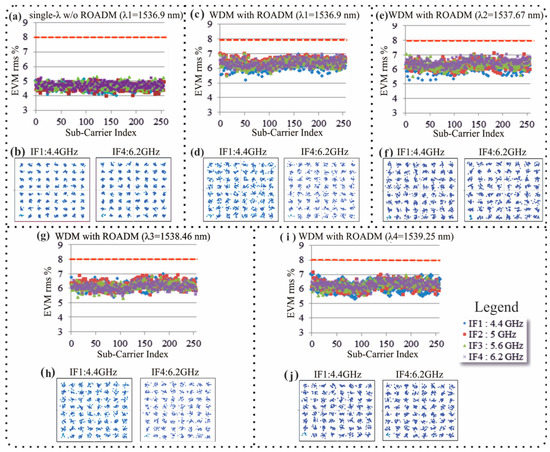
Initially, the performance of the reference single-wavelength link without any ROADM, using four aggregated OFDM IF channels modulated with 64-QAM format, was examined. The SMF length interconnecting the EML with the VOA of the Rx was considered equal to 500 m, based on the typical stadium periphery specifications. The total received optical power (ROP) before the PD was adjusted to be equal to −13 dBm for all IF bands for comparison purposes against the WDM hotspot link. Figure 7a shows the EVM values per SC for each IF channel, revealing similar performance for all IF OFDM signals with an average EVM of 4.6%. Figure 7b depicts two indicative constellation diagrams for the worst-performing SCs of the outermost IF bands of 4.4 GHz (IF1) and 6.2 GHz (IF4), exhibiting EVM values of 5.1% and 5.2%, respectively. It should be noted that the performance of all SCs was within the acceptable threshold of 8% as it is defined by 3GPP for the base station radio transmission and reception of NR carriers with 64-QAM format [68,69].
Figure 7. Link w/o ROADM and single λ transmission of OFDM 64-QAM: (a) EVM per SC for all IF bands for λ1 at a ROP of −13 dBm, (b) constellation diagrams of the worst performing SC for the first and last IF band. Hotspot WDM Link with ROADM: (c) EVM per SC for all IF bands for WDM1 (λ1 = 1536.9 nm) at a minimum ROP of −13 dBm, (d) constellation diagrams of the worst performing SC for the first and last IF band at λ1. (e) EVM per SC for all IF bands for WDM3 (λ3 = 1538.46 nm) at a minimum ROP of −13 dBm, (f) constellation diagrams of the worst performing SC for the first and last IF band at λ3.
After the evaluation of the single-wavelength link, we investigated the additional degradation added by the 4-λ WDM transmission and the ROADM modules for the longest reach RRH of the hotspot fronthaul architecture, i.e., when the WDM data signals crossed through the first three ROADMs and being dropped at the last ROADM. This study corresponds to the single origin capacity problem that requires all the resources to be allocated in a specific area of the hotspot. The SMF length interconnecting the BBU with the first ROADM was considered equal to 500 m and the ROP corresponding to each wavelength was equal to −13 dBm, resulted by taking into account the maximum losses of the individual devices employed in the hotspot link and a moderate transmitted optical power (TOP) per wavelength equal to 1.1 dBm. This value is lower than the maximum available TOP of 2.8 dBm that each EML can output for modulated signals [55] and it was chosen in order to present the EVM measurements for a non-optimal ROP. Figure 7c presents the EVM values per SC for all IF channels of the first WDM wavelength of 1536.9 nm. As it is shown, all IF bands at the center frequencies of 4.4 GHz, 5 GHz, 5.6 GHz, and 6.2 GHz exhibited similar performance with an average EVM value of 6.3%. The constellation diagrams for the worst performing SC of the first IF the last IF band are depicted in Figure 7d, exhibiting EVMs of 7% and 6.9%, respectively. Similar performance was obtained for all the other WDM channels with EVM values within the threshold of 8%. Figure 7e shows the EVM measurements versus the SC index for all four IF bands carried by the second WDM wavelength of 1537.67 nm. As it can be seen, all IF bands exhibited again similar performance with the EVM values of the SCs ranging between 5.2% and 7.1%. Despite these slight deviations, all SCs achieved EVM values within the 3GPP threshold limit of 8%. Figure 7f presents the constellation diagrams for the worst performing SCs of the first and last IF, exhibiting an EVM of 7.1% and 7.05%, respectively. Figure 7g,h depict the respective EVM measurements and constellation diagrams for the third WDM wavelength of 1538.46 nm, respectively, while Figure 7i,j present the respective set of results for the fourth WDM channel at 1539.25 nm, exhibiting similar performance within the 8% EVM limit.
In order to investigate the scenario where the available downlink capacity resources is needed to be uniform distributed on the hotspot area (denoted as the multi-origin capacity problem), we carried out EVM measurements for the case that the WDM channels were dropped one by one in the peripheral of the stadium by the respective ROADMs. The multi-origin capacity scenario was investigated also for the uplink fronthaul link by performing EVM measurements for the WDM channels that were consecutively added by the respective ROADMs of the uplink bus and received by the array of PDs at the centralized BBU side.
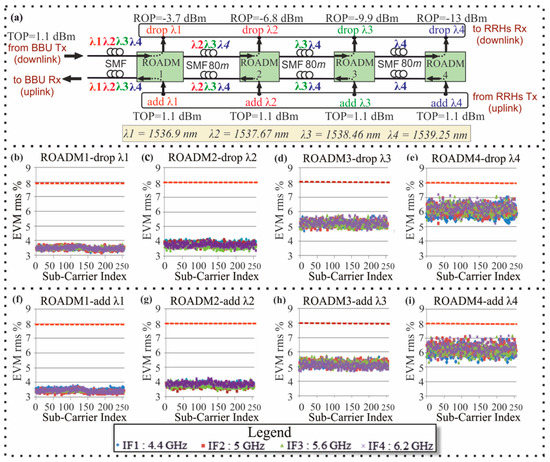
Figure 8a presents the employed setup for the simultaneous downlink and uplink transmission of four WDM channels, each one carrying four IF band signals with the format parameters presented in Table 1. Focusing on the downlink direction, the BBU’s Tx has transmitted four WDM channels as shown in Figure 6b, with each of them chosen to exhibit a TOP equal to 1.1 dBm. The WDM signal was transmitted through a 500 m length SMF to the hotspot, where the WDM channels at λ1, λ2, λ3, λ4 were consecutively dropped from ROADMs 1–4, respectively. The signal at the output of each ROADM was received by a photo-receiver (PD + TIA) before entering the evaluation unit shown in Figure 6b. Taking into account the power budget of the downlink and a TOP equal to 1.1 dBm, the ROP at the output of the fourth ROADM was found to be equal to −13 dBm. Considering that the total loss of the ROADM module was equal to 3.1 dB, the ROP values at the output of the ROADMs 3, 2, 1 have been calculated equal to −9.9 dBm, −6.8 dBm, and −3.7 dBm, respectively.
Figure 8. (a) Simulation setup of the WDM downlink and uplink optical bus where downlink λ1, λ2, λ3, λ4 data signals are subsequently dropped by ROADMs 1–4 and uplink λ4, λ3, λ2, λ1 data signals are subsequently added by ROADMs 4,3,2,1, respectively. EVM per SC for all IF bands for the (b) downlink WDM1 (λ1 = 1536.9 nm) at a ROP of −3.7 dBm, (c) downlink WDM2 (λ2 = 1537.67 nm) at a ROP of −6.8 dBm, (d) downlink WDM3 (λ3 = 1538.46 nm) at a ROP of −9.9 dBm and (e) downlink WDM4 (λ4 = 1539.25 nm) at a ROP of −13 dBm, (f) uplink WDM1 (λ1 = 1536.9 nm) at a ROP of −3.7 dBm, (g) uplink WDM2 (λ2 = 1537.67 nm) at a ROP of −6.8 dBm, (h) uplink WDM3 (λ3 = 1538.46 nm) at a ROP of −9.9 dBm and (i) ulink WDM4 (λ4 = 1539.25 nm) at a ROP of −13 dBm.
Focusing on the uplink direction, each RRH added a different WDM channel into the uplink bus through the respective ROADM. Particularly, WDM channels at λ4, λ3, λ2, λ1 were consecutively added into the link from ROADMs 4, 3, 2 and 1, respectively, each one with a TOP equal to 1.1 dBm. The uplink 4-wavelength WDM signal at the exit of the hotspot was then transmitted through a SMF with a length of 500 m, demultiplexed by the DEMUX of the BBU and received by its array of photo-receivers as presented in Figure 1b. The ROP of the channels carried by λ1, λ2, λ3, λ4 was calculated equal to −3.7 dBm, −6.8 dBm, −9.9 dBm and −13 dBm, respectively, using the same procedure as in case of the downlink. Finally, the electrical converted signals at the output of the photo-receivers sent to the evaluation unit of the BBU, comprising the same circuit shown in Figure 6b for the end user.
Figure 8b–e show the EVM values per SC of all IF bands for the downlink WDM channels at λ1, λ2, λ3, λ4, respectively. Figure 8b reveals that the signal carried by λ1 and dropped by ROADM 1 exhibited SC EVM values between 3.15–3.7%. Figure 8c,d present the EVM values for λ2 and λ3, exhibiting EVM values between 3.3–4.1% and 4.6–5.7%, respectively. Finally, Figure 8e shows that the signal at λ4 exiting the last ROADM exhibited the worst performance with the EVM values of the different SCs ranging between 5–7.1%. By comparing the performance of the different WDM channels, it is observed that as the available optical power of the dropped signals was decreasing due to the ROADM losses, the EVM values were increasing. A maximum EVM difference of 3.5% was found between the worst performing SC of the different wavelength channels. By comparing the EVM measurements obtained for this multi-origin downlink capacity problem with the respective results for the single-origin capacity problem presented in Figure 7c,i, similar performance was shown for the fourth WDM channel. The performance of the other three channels (WDM1–WDM3) was found to be better for the multi-origin capacity case.
Figure 8f–i present the respective EVM values per SC of all IF bands for the uplink WDM channels at λ1, λ2, λ3, λ4, respectively. Figure 8f reveals that the signal carried by λ1 and added by ROADM 1 exhibited SC EVM values between 3.1–3.7%. Figure 8g,h shows the EVM values for λ2 and λ3 added by ROADM 2 and 3, exhibiting EVM values between 3.3–4.15% and 4.6–5.7%, respectively, Figure 8i presents the EVM values for the signal carried by λ4 exiting the last ROADM. This channel exhibited the worst performance when compared with the other uplink channels with the EVM values of the different SCs ranging between 5.1–7.1%. When comparing the performance of the downlink and uplink fronthaul link, similar performance was observed.
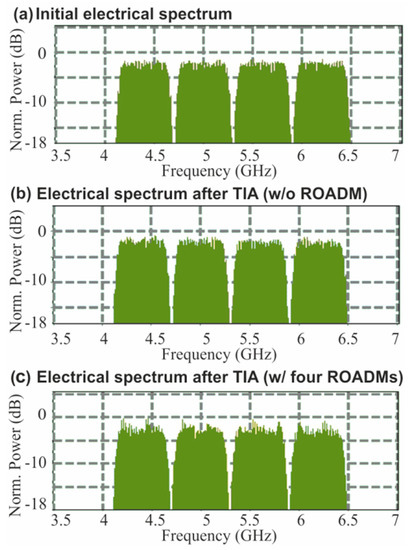
Figure 9 presents the IF spectra diagrams for three different cases: (a) the initial aggregated 4-IF band signal inserted into the EML, (b) the signal exiting the photo-receiver (PD + TIA) of the reference link without any ROADM, and (c) the respective signal transmitted through the WDM hotspot link and exiting the last ROADM. Figure 9a presents the normalized spectrum of the aggregated multi-IF band signal that was electrically generated at the Tx side and entered the EML to modulate the wavelength of 1536.9 nm (λ1). As it can be seen, the spectral power density was constant for all IF bands of the generated signal. Almost constant power spectral density was also shown in Figure 9b for the o/e converted signal exiting the photo-receiver (PD + TIA) of the single-wavelength link where no ROADMs were used, implying a similar performance for all IF channels, as it has already been confirmed in Figure 7a,b. A spectral behavior with almost constant power spectral density was also revealed for the o/e converted multi-IF band signal at the output of the TIA connected with the drop port of the fourth ROADM, as shown in Figure 9c.
Figure 9. IF Spectra of (a) the OFDM 64-QAM signal inserted the EML, (b) o/e converted and amplified signal exiting the TIA for the reference link without any ROADM, and (c) the signal exiting the TIA for the hotspot link with the first three ROADMs in through mode and the ROADM4 in drop mode.
In this case, the signal was transmitted through the WDM hotspot link shown in Figure 6b. This is an evidence that the EML, the fiber length of 500 m, as well as the ROADM device have affected uniformly the performance of the different IF bands, justifying the results showed in Figure 7c–j. Focusing on the spectral content of each IF band of the WDM channel shown in Figure 9c, it can be also observed that the individual SCs exhibited different power levels with a non-uniformity of ~2.5 dB. The SCs of the respective IF band during single wavelength transmission (i.e., no ROADMs) exhibit better power uniformity with a value equal to 1 dB as shown in Figure 9b. This additional signal distortions within the IF bands of the WDM channel is also consistent with the EVM analysis presented in Figure 7. Particularly, as shown in Figure 7c,e,g,i, the EVM values during WDM transmission are ranging between 5.1–7.1%, while the respective EVM values the single-wavelength transmission were lower, ranging between 4–5.2% (Figure 7a).
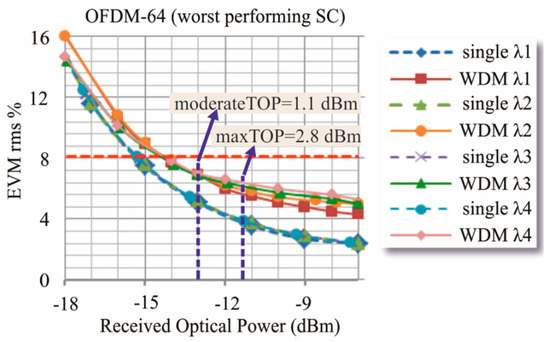
Figure 10 shows the received EVM for the worst performing SC of the multi-IF transmission versus the ROP, for each of the WDM channels λ1, λ2, λ3, λ4 transmitted through the first three ROADMs and dropped by the fourth ROADM. A fiber length of 500 m was employed in order to interconnect the BBU with the first ROADM of the optical bus. The respective EVM curves for the single-λ transmission of λ1, λ2, λ3, λ4 without the use of ROADMs are also presented in Figure 10.
Figure 10. EVM versus ROP (dBm) for the worst performing SC of each WDM channel. Respective EVM curves for the single-λ transmission at λ1λ2λ3λ4.
As it is shown, all WDM channels exhibit similar performance, achieving EVMs within the 3GPP threshold of 8% when the ROP is higher than −14.3 dBm. It should be also noted that a relatively low power penalty of 1.2 dB was obtained with respect to the single-λ transmission at the EVM of 8%.
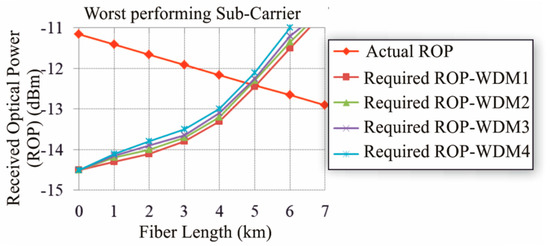
A power budget analysis of the proposed hotspot fronthaul architecture was carried out to calculate the actual ROP of the signal reaching PD of the fourth RRH. The purpose of this analysis is to compare the ROP calculated by the power budget with the required ROP of −14.3 dBm, dictated by the EVM measurements (Figure 10). Table 2 summarizes the power budget parameters of the main building blocks incorporated in the WDM hotspot link. By considering an EML modulated average TOP of 2.8 dBm [55] and subtracting the losses of the MUX, SMF [59] and the four ROADMs (Section 4.3), an actual ROP of −11.3 dBm was calculated before the PD of the fourth ROADM for a SMF length of 500 m. The fact that the ROP of the power budget analysis is higher than the ROP of −14.3 dBm required in order to achieve an EVM of 8%, showing actually a power margin of 3 dB (3 dB = −11.3 dBm − (−14.3 dBm)), indicates that all WDM multi-IF band signals can be successfully transmitted over the proposed hotspot fronthaul link with sufficient power budget. The EVM values of the worst performing SC for the ROP of −11.3 dBm (maxTOP = 2.8 dBm) was found to range between 5.6%–6.3%. The minimum and maximum EVM values correspond to the λ1 and λ4, respectively. The respective EVM value for the moderate TOP of 1.1 dBm, used for the EVM versus SC index measurements, was found to be 7–7.1%.
Table 2. Power budget parameters.

5.3. Fiber Length Study

To investigate the longest reach that the BBU box can be placed in the backhaul or the metro-core of the network, we performed a fiber length study with the main criteria being the EVM value of the received data signal after the fourth ROADM to be within the acceptable threshold set by 3GPP. To this end, we considered the same topology for the hotspot fronthaul, as shown in Figure 6b, with the fiber length between the BBU and the first ROADM extended up to a few km. Figure 11 depicts the ROP versus the length of the SMF fiber between the BBU and the first ROADM, where the red line corresponds to the actual ROP in dBm reaching the PDs of the fourth RRH. The actual ROP was calculated by taking into account the insertion and propagation losses of the building blocks used in the fronthaul link as it is shown in Table 2.
Figure 11. ROP versus the length of the fiber connecting the BBU with the first ROADM. Curve of the actual ROP deriving from the power budget of the hotspot link and curves of the ROP required to achieve an EVM = 8% for all WDM channels.
In this power budget analysis, when the SMF length was equal to 0 (back-to-back), the actual ROP was calculated equal to −11.16 dBm for an EML modulated average output power of 2.8 dBm [55], MUX and ROADM losses of 1.5 dB and 3.1 dB, respectively. As the SMF fiber length increased, the actual ROP was linearly decreasing, reaching the value of −13 dBm at a length of 7 km due to the SMF propagation losses of 0.25 dB/km [59]. The other four curves correspond to the four WDM channels and show the ROP required at the PDs of the fourth RRH in order to achieve EVM of 8% for the worst performing SC modulated with 64-QAM. As it can be observed, the EVM degraded for all channels as the fiber length increases due to the signal impairments stemming from the chromatic dispersion, resulting in slightly higher ROP for the highest wavelength channel of 1539.25 nm. By comparing the actual and the required ROP, it can be seen that these curves cross at a length of 4.8 km. After this crossing the required ROP was higher than the available power budget, implying severe performance degradation. This reveals that the longest acceptable distance between the BBU and the hotspot area can be 4.8 km without using any repeater.

6. Conclusions

In this paper, we presented an analog optical fronthaul 5G architecture employing OFDM-based IFoF WDM links and PIC technologies to meet the high-bandwidth requirements of overcrowded privately owned hotspot areas in a low-cost and energy efficient manner. The proposed fronthaul exploits WDM PIC-based optical Txs for the multicarrier IFoF signal generation at the BBU site and low-loss ROADMs at the RRH nodes arranged on a bus topology facilitating wavelength selectivity and re-configurability of up to four4 WDM channels. Robust EVM performance with an aggregated capacity of almost close to 100 Gb/s was achieved by employing WDM IFoF transmission of OFDM signals with frequency aggregation of 4-IF bands and SC modulation of 64-QAM at a channel baud rate of 0.5 Gbd. Finally, the fiber length study showed that the BBU box may be placed at a distance up to 4.8 km from the hotspot area. The proposed fronthaul architecture may find applications in high-traffic overcrowded hotspot areas within the 5G frame.